Fig. 2
Download original image
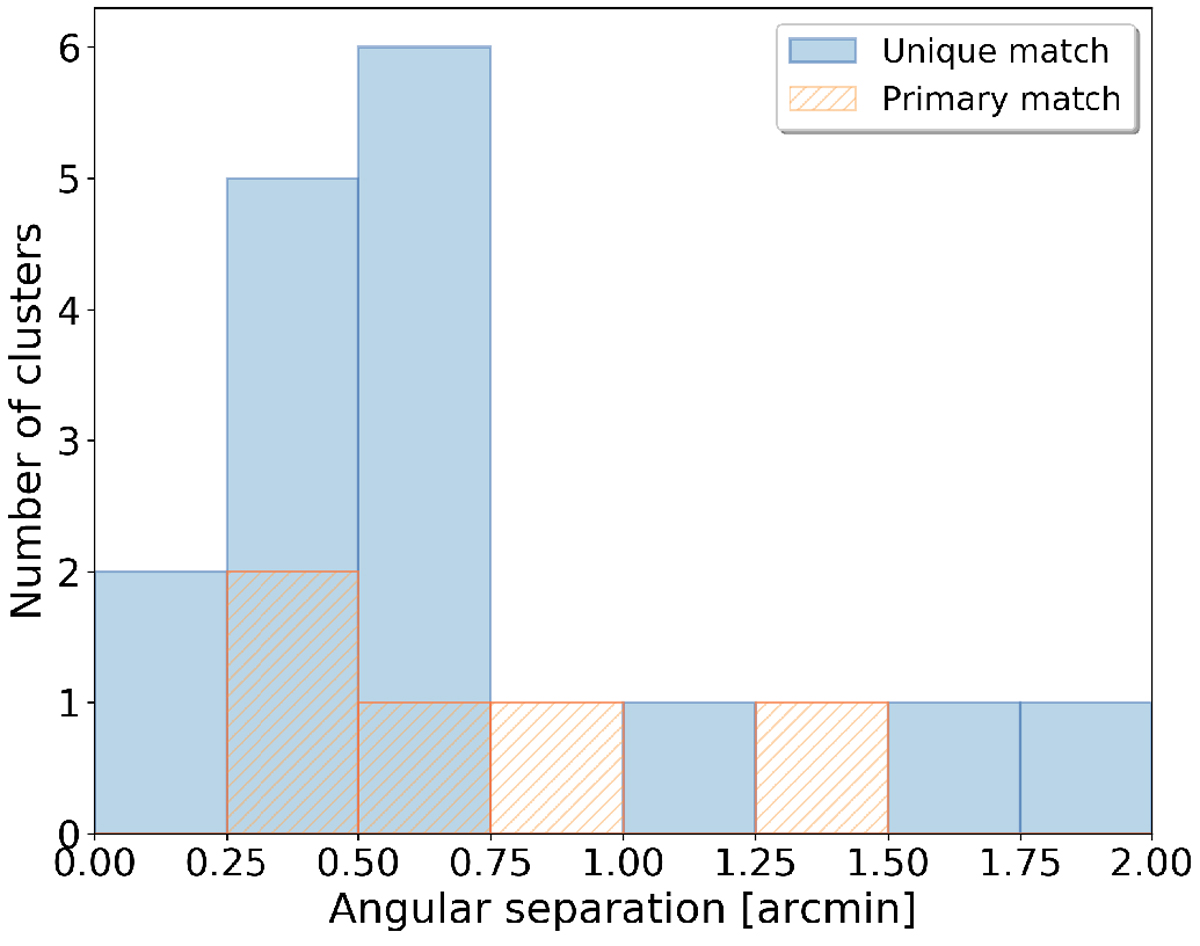
Distribution of the angular separation, in arcmin, between the shear-selected clusters and the closest X-ray detected (eFEDS) clusters. In blue, clusters are shown which have one unique match between the catalogues within 5 arcmin and with a redshift difference |∆z| < 0.1. The orange histogram displays primary matches for clusters with multiple matches. Primary matches correspond to the most X-ray luminous (and in most cases the closest) eFEDS counterpart.
Current usage metrics show cumulative count of Article Views (full-text article views including HTML views, PDF and ePub downloads, according to the available data) and Abstracts Views on Vision4Press platform.
Data correspond to usage on the plateform after 2015. The current usage metrics is available 48-96 hours after online publication and is updated daily on week days.
Initial download of the metrics may take a while.