Fig. 1
Download original image
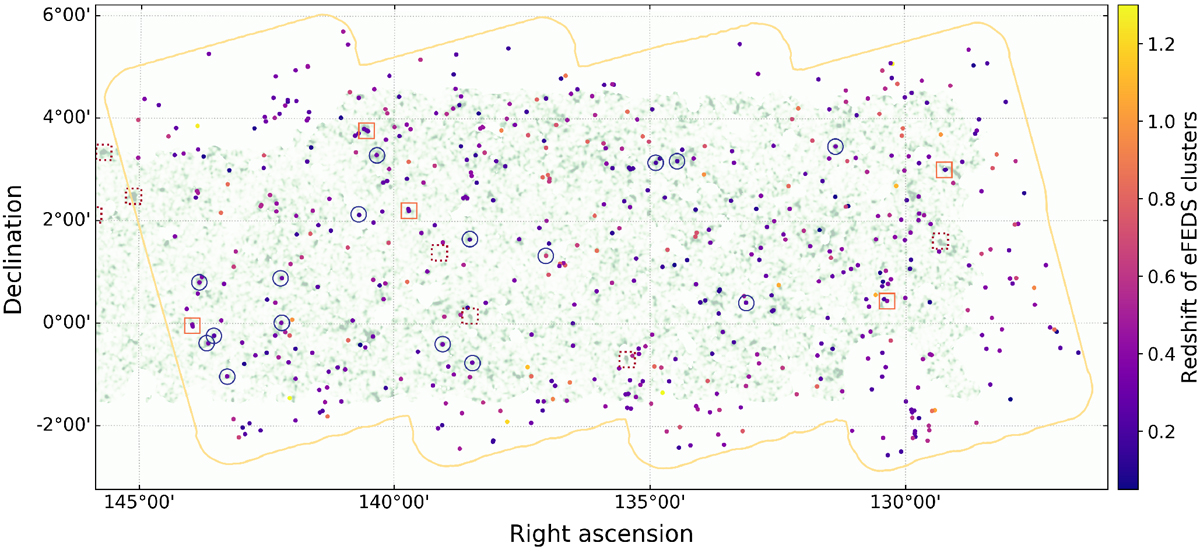
Part of the weak lensing map for the GAMA09H HSC-SSP S19A field (green background). The solid yellow line shows the eFEDS survey footprint. Small filled circles show the location of eFEDS clusters with z > 0.05, whose colours correspond to their redshift as shown by the colour bar. Open symbols show the position of the shear-selected clusters: blue circles correspond to peaks that have one counterpart in the eFEDS catalogue, orange squares are weak-lensing peaks with two or three eFEDS counterparts, and dotted red squares are peaks with no eFEDS counterparts.
Current usage metrics show cumulative count of Article Views (full-text article views including HTML views, PDF and ePub downloads, according to the available data) and Abstracts Views on Vision4Press platform.
Data correspond to usage on the plateform after 2015. The current usage metrics is available 48-96 hours after online publication and is updated daily on week days.
Initial download of the metrics may take a while.