Free Access
Fig. 6.
Download original image
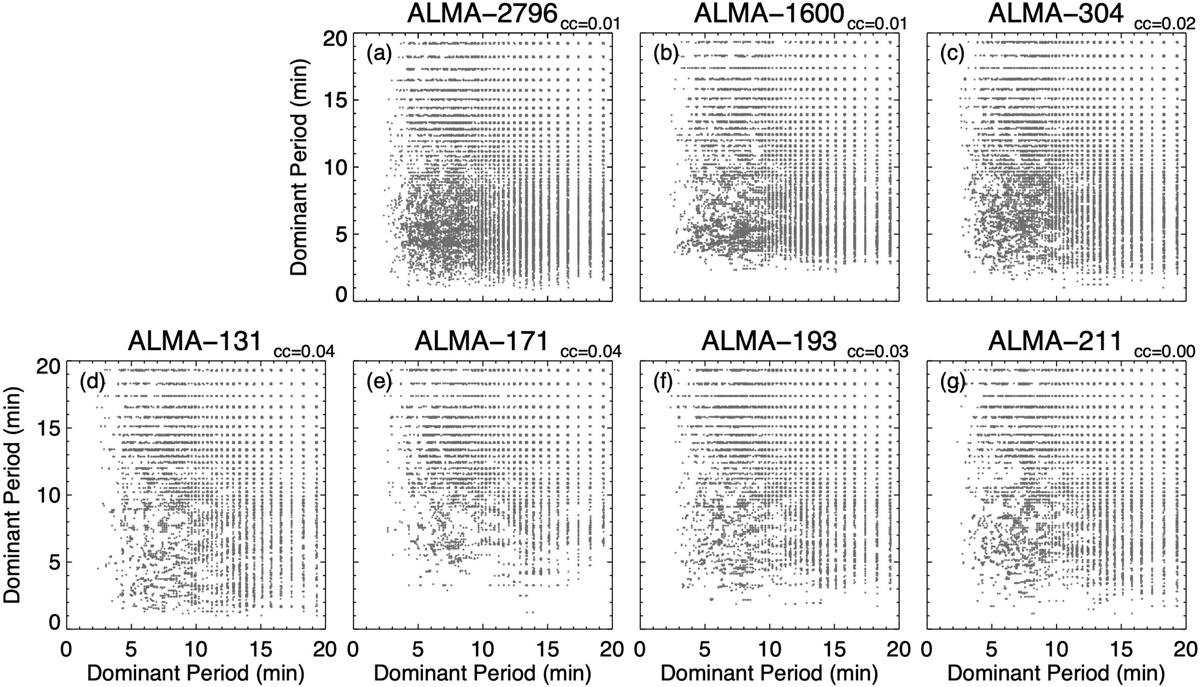
Scatter plots, for the full FoV, of the ALMA Band-6 dominant period map shown along with that from IRIS 2796 Å in panel a and different AIA channels in panels b–g. The value of the cross-correlation coefficient (“cc”) is shown to the top right of each panel.
Current usage metrics show cumulative count of Article Views (full-text article views including HTML views, PDF and ePub downloads, according to the available data) and Abstracts Views on Vision4Press platform.
Data correspond to usage on the plateform after 2015. The current usage metrics is available 48-96 hours after online publication and is updated daily on week days.
Initial download of the metrics may take a while.