Free Access
Fig. A.1.
Download original image
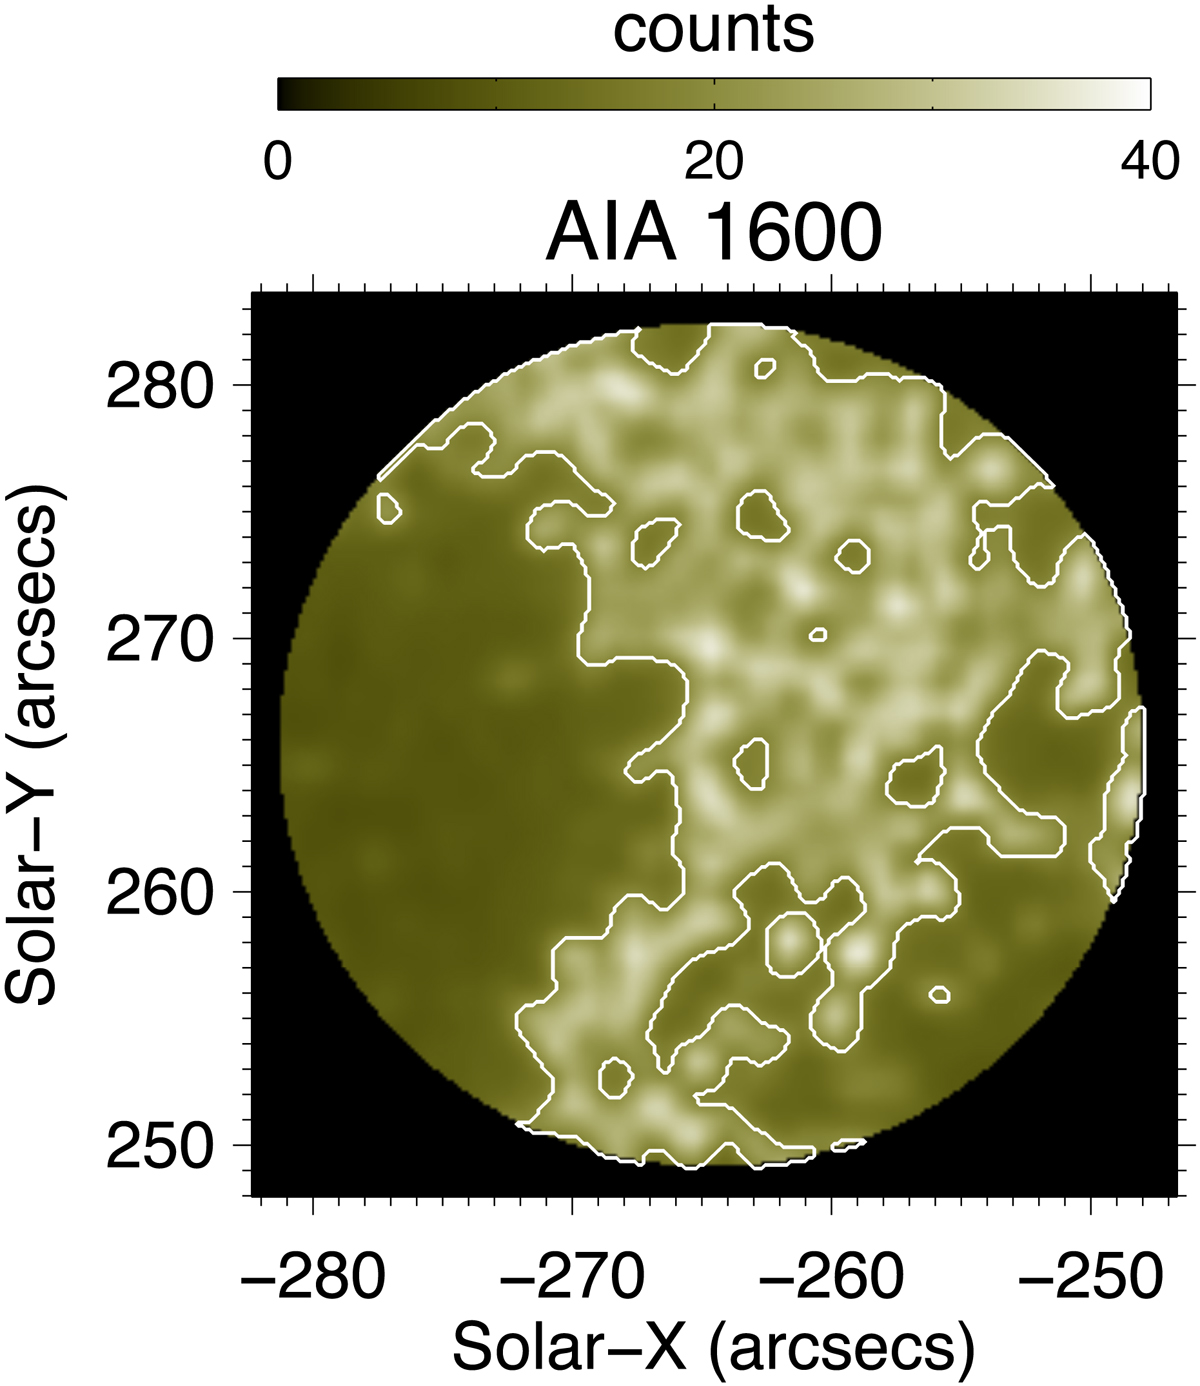
Time-averaged AIA 1600 Å intensity image of the studied FoV. Overplotted are the white contours that enclose the bright plage region. The surrounding area (outside the contours) is the peripheral region.
Current usage metrics show cumulative count of Article Views (full-text article views including HTML views, PDF and ePub downloads, according to the available data) and Abstracts Views on Vision4Press platform.
Data correspond to usage on the plateform after 2015. The current usage metrics is available 48-96 hours after online publication and is updated daily on week days.
Initial download of the metrics may take a while.