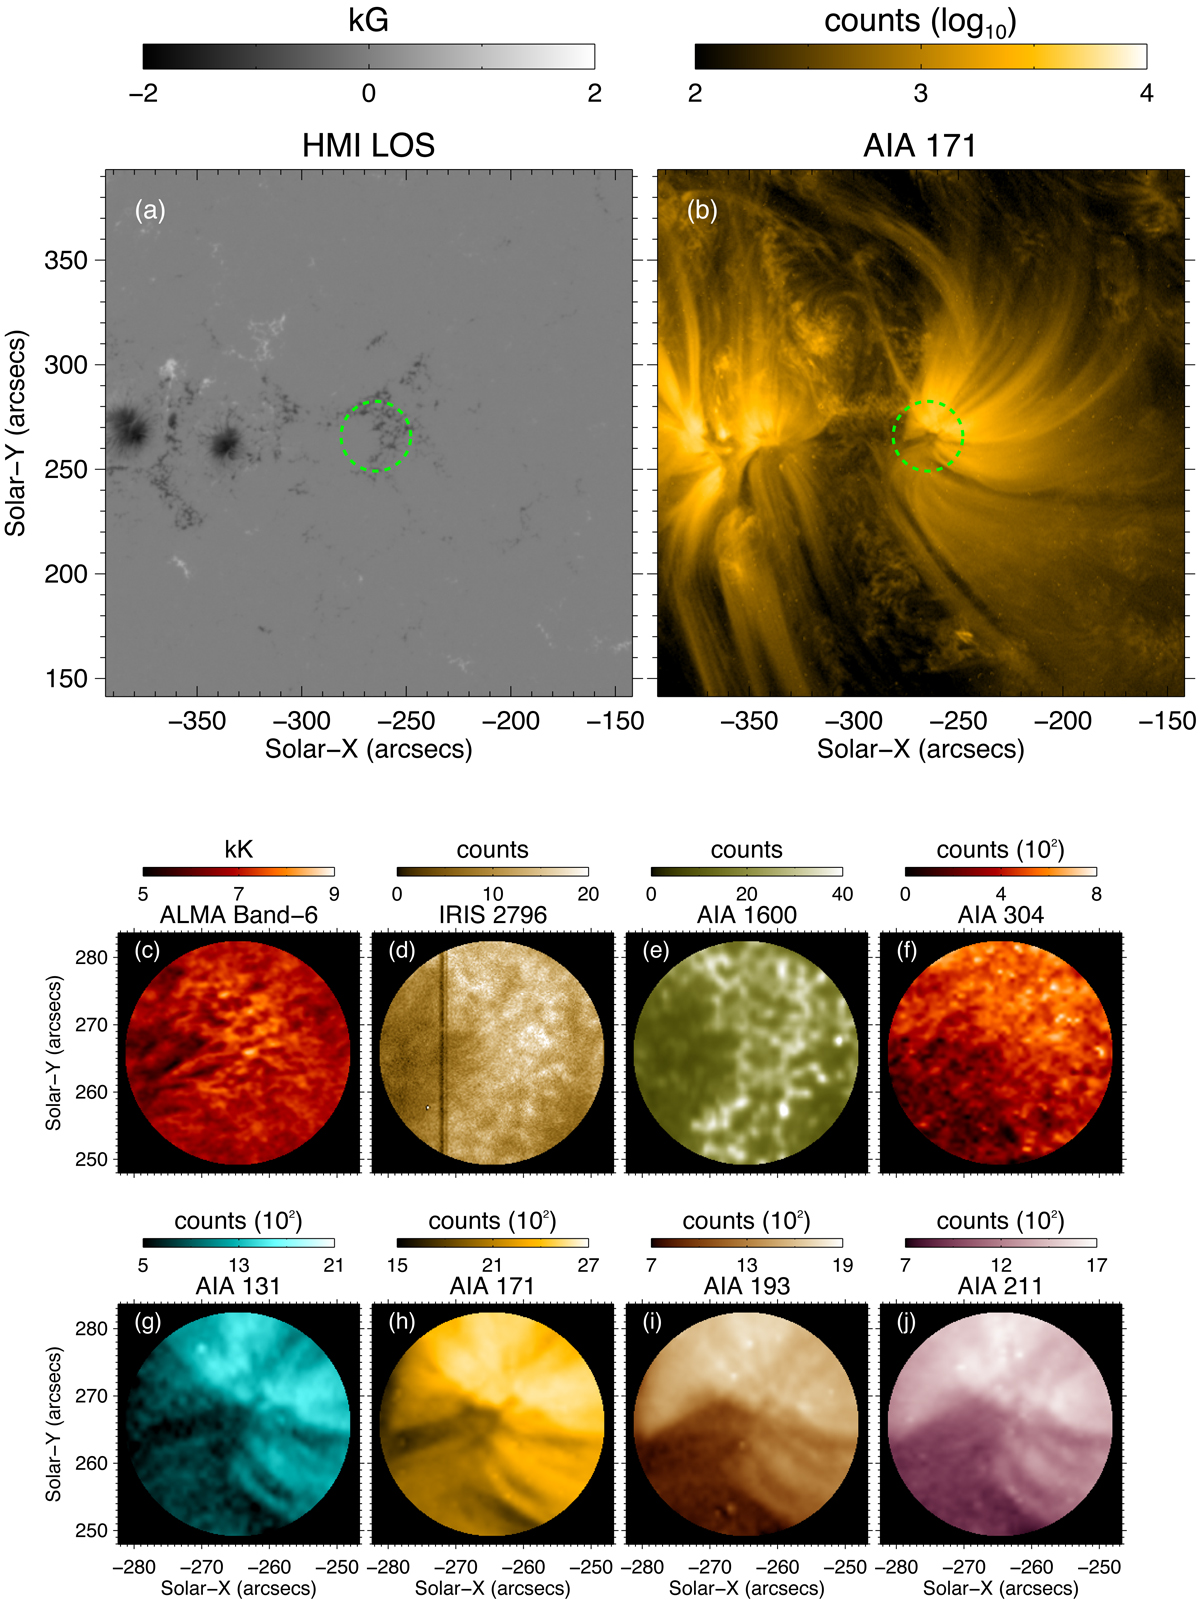
Fig. 1.
Download original image
Context images showing the HMI line-of-sight (LOS) magnetogram in panel a and the AIA 171 Å image in panel b at the start time of the ALMA observations. The FoV studied here is marked by the green circle in panels a and b. Panels c–j: show the representative images of the studied FoV (from ALMA Band 6, IRIS SJI 2796 Å, and different AIA channels, as indicated on top of the panels) at the start time of the observations.
Current usage metrics show cumulative count of Article Views (full-text article views including HTML views, PDF and ePub downloads, according to the available data) and Abstracts Views on Vision4Press platform.
Data correspond to usage on the plateform after 2015. The current usage metrics is available 48-96 hours after online publication and is updated daily on week days.
Initial download of the metrics may take a while.