Fig. 9
Download original image
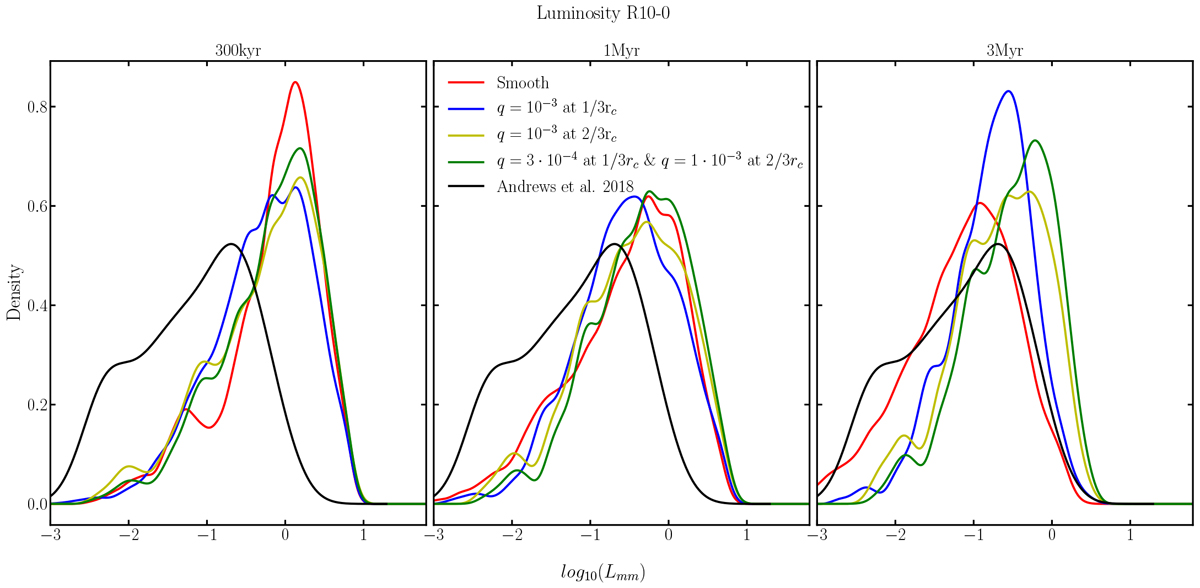
Kernel density distribution of the luminosity for all matching simulations using the Ricci et al. (2010) R10-0 opacity model, for four different cases and three different snapshots, from 300kyr – 3 Myr. The black line refers to the disks from the Andrews et al. (2018b) sample. Disks with planets have higher luminosity, while smooth disks have low luminosity at 3 Myr. When two planets are included the luminosity is higher than with a single planet.
Current usage metrics show cumulative count of Article Views (full-text article views including HTML views, PDF and ePub downloads, according to the available data) and Abstracts Views on Vision4Press platform.
Data correspond to usage on the plateform after 2015. The current usage metrics is available 48-96 hours after online publication and is updated daily on week days.
Initial download of the metrics may take a while.