Fig. 8
Download original image
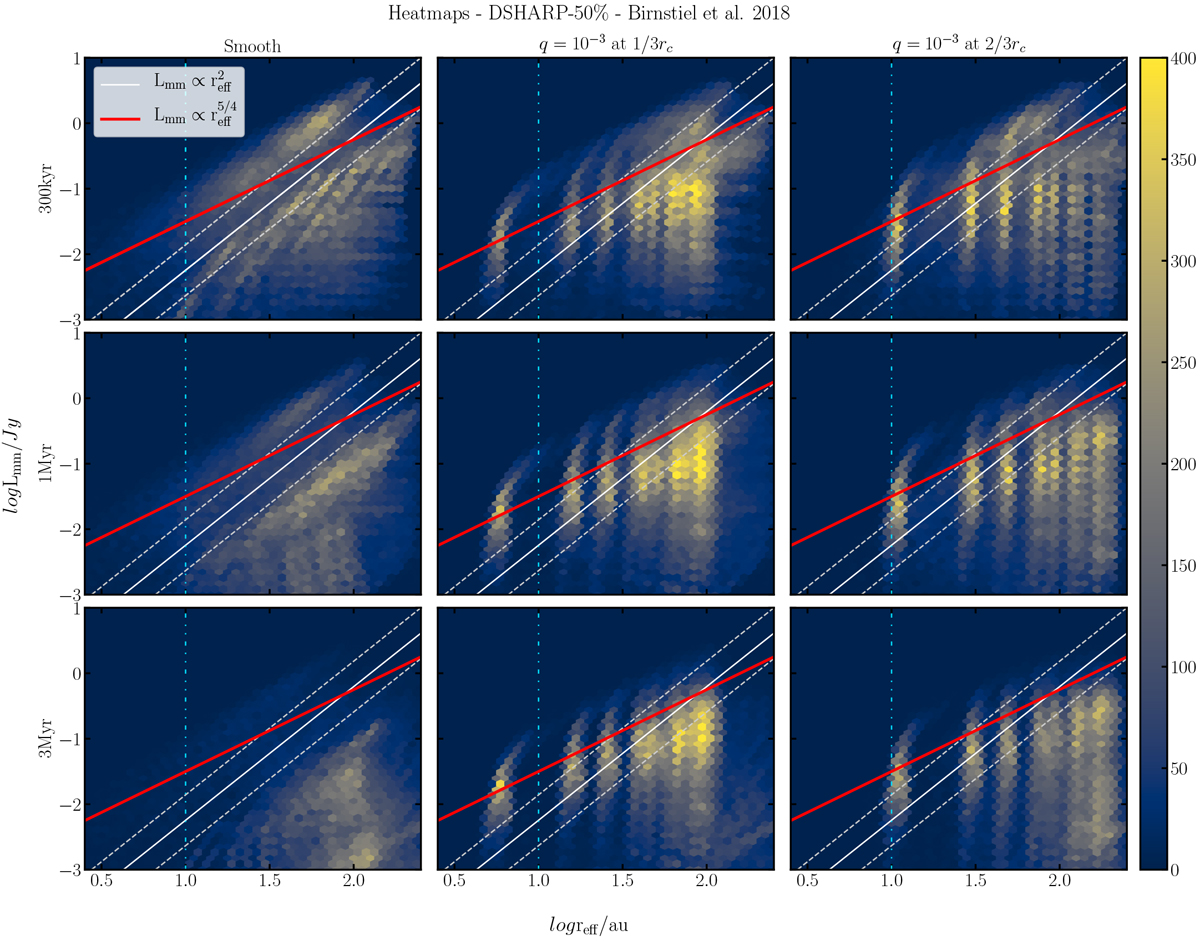
Heat maps of simulations with the Birnstiel et al. (2018) D-50 opacities with 50% porostiy. From left to right, the three columns represent the smooth case, a planet at 1 /3rc, and a planet at 2/3rc. From top to bottom, the rows represent three different snapshots at 300 kyr, 1 Myr, and 3 Myr. The white solid line is the SLR from Andrews et al. (2018b) and the red solid line our fit for the cases where a planet is included. The color bar shows the number of simulations in a single cell. The blue dash-dotted line shows the minimum limit (reff ~ 10 au) where observational results are available.
Current usage metrics show cumulative count of Article Views (full-text article views including HTML views, PDF and ePub downloads, according to the available data) and Abstracts Views on Vision4Press platform.
Data correspond to usage on the plateform after 2015. The current usage metrics is available 48-96 hours after online publication and is updated daily on week days.
Initial download of the metrics may take a while.