Fig. 5
Download original image
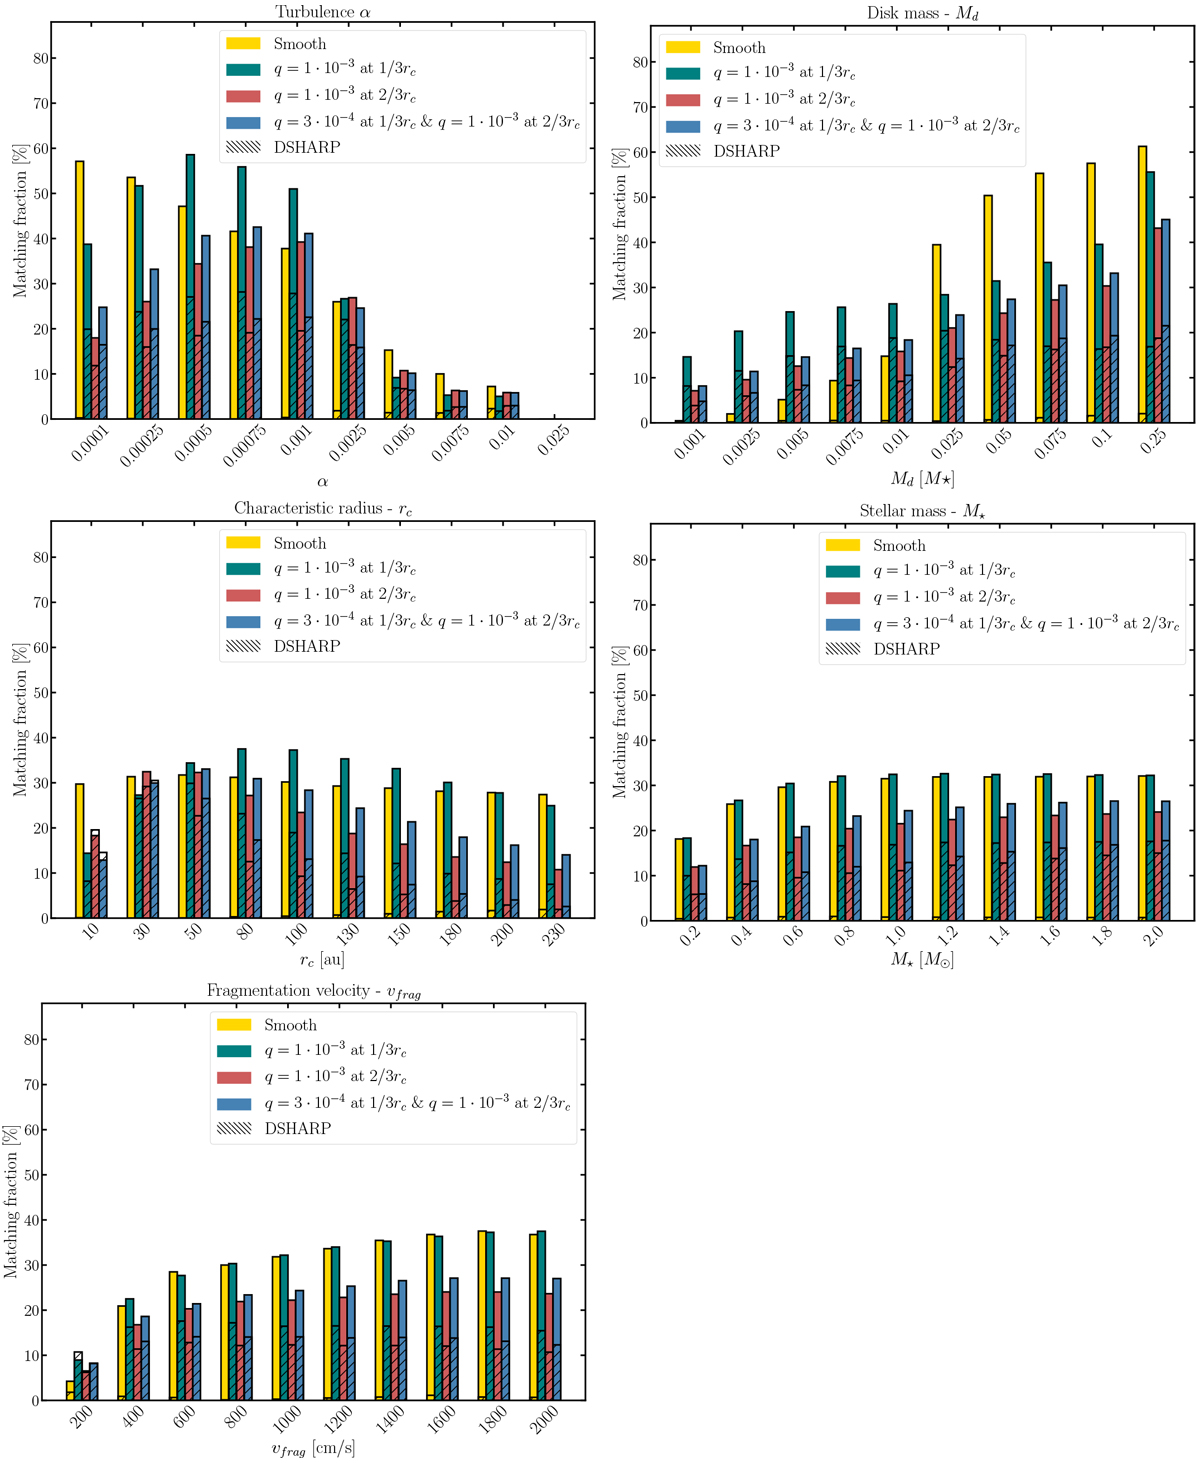
Histograms of the matching fraction for disk mass, characteristic radius, stellar mass, and fragmentation velocity. The matching fraction shows the percentage of the simulations that remained on the SLR for the chosen time span (300 kyr − 3 Myr). Top left: dependence on the α-value. There is a preference to low α-values (10−4 ≤ α ≤ 10−3). Top right: dependence on the disk mass. There is a preference to high disk masses ![]() . Middle left: dependence on the characteristic radius. Smooth disks do not depend on the rc. Middle right: dependence on the stellar mass. There is a slight preference to higher values. Bottom left: dependence on the fragmentation velocity. There is a slight preference to higher values.
. Middle left: dependence on the characteristic radius. Smooth disks do not depend on the rc. Middle right: dependence on the stellar mass. There is a slight preference to higher values. Bottom left: dependence on the fragmentation velocity. There is a slight preference to higher values.
Current usage metrics show cumulative count of Article Views (full-text article views including HTML views, PDF and ePub downloads, according to the available data) and Abstracts Views on Vision4Press platform.
Data correspond to usage on the plateform after 2015. The current usage metrics is available 48-96 hours after online publication and is updated daily on week days.
Initial download of the metrics may take a while.