Fig. 2
Download original image
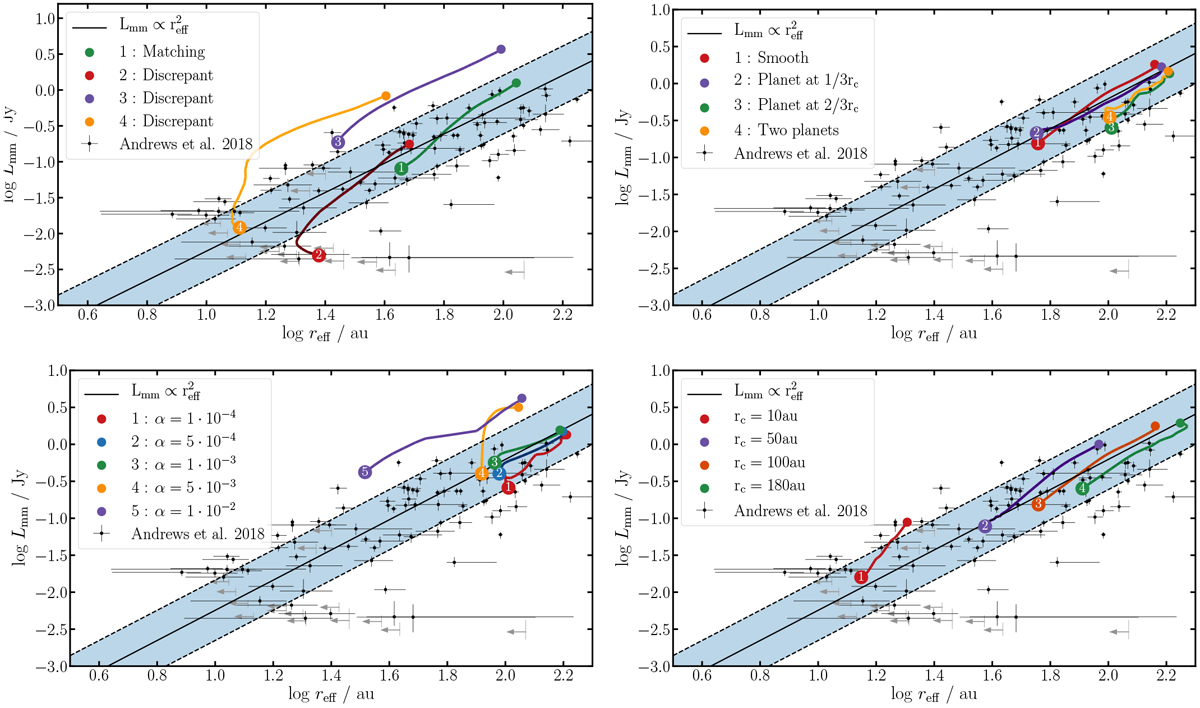
Evolution tracks and explanation of matching and discrepant simulations. Examples of a disk with the same initial conditions varying only one parameter at a time. Top left: SLR according to Andrews et al. (2018b) and examples of evolution tracks. The black points correspond to the observational data, and the black dashed line is Eq. (13), which shows the relation between the luminosity and the effective radius. Finally, the blue shaded region is the area within 1σ of the SLR where the simulations are considered to be matching. The green track labeled number 1 is considered a matching simulation since it starts and ends inside the SLR. The other tracks are considered discrepant. The beginning of the track is where the empty bullet is (top right) and the end is where the number is found (bottom left). Top right: varying only the presence and the position of a Jupiter-mass planet. The red line (number 1) is for a smooth disk and the green line (number 3) for a disk with a Jupiter-mass planet at 2/3 of the rc; the purple line (number 2) corresponds to a planet at 1/3 of the rc and the yellow line (number 4) to a simulation with two planets at the positions mentioned above. Bottom left: varying only the turbulence parameter α. Higher α values lead to higher luminosity. Bottom right: varying only the characteristic radius rc. Higher rc values lead to larger and more luminous disks.
Current usage metrics show cumulative count of Article Views (full-text article views including HTML views, PDF and ePub downloads, according to the available data) and Abstracts Views on Vision4Press platform.
Data correspond to usage on the plateform after 2015. The current usage metrics is available 48-96 hours after online publication and is updated daily on week days.
Initial download of the metrics may take a while.