Fig. C.2
Download original image
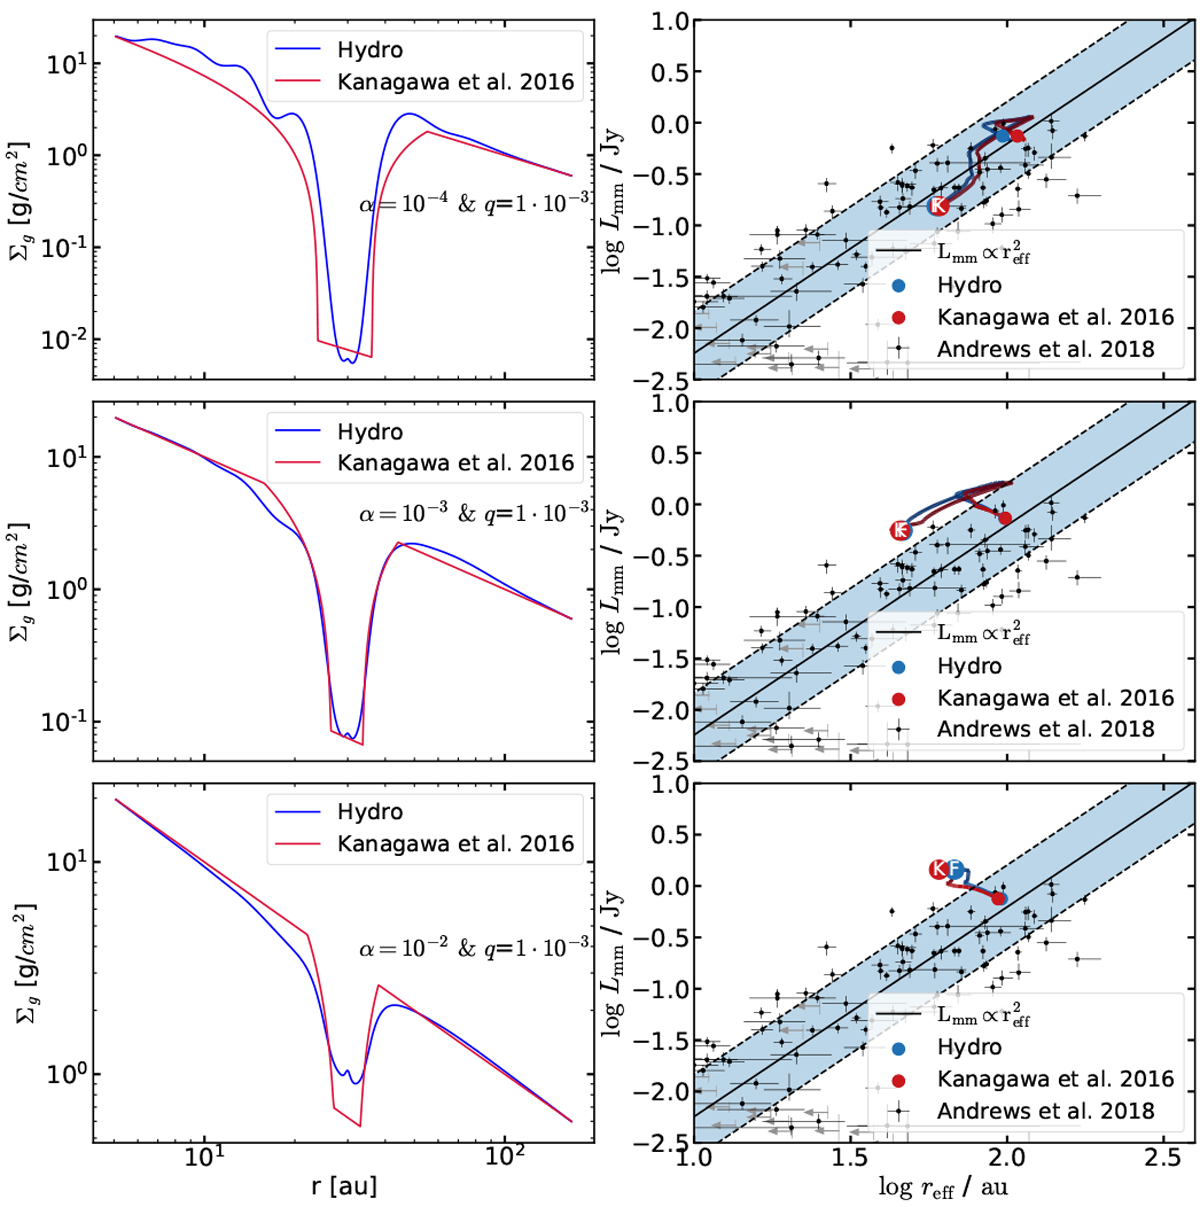
Comparison between a hydrodynamical and our dust evolution simulation for different α-values and for a planet/star mass ratio q = 10−3 at 30 au. In the left column are the different gap profiles for different α-values and in the right column the corresponding evolution tracks. Even though the profile from Kanagawa et al. (2016) does not overlapping with that obtained from the hydrodynamical simulation, the tracks in the right column produce similar results.
Current usage metrics show cumulative count of Article Views (full-text article views including HTML views, PDF and ePub downloads, according to the available data) and Abstracts Views on Vision4Press platform.
Data correspond to usage on the plateform after 2015. The current usage metrics is available 48-96 hours after online publication and is updated daily on week days.
Initial download of the metrics may take a while.