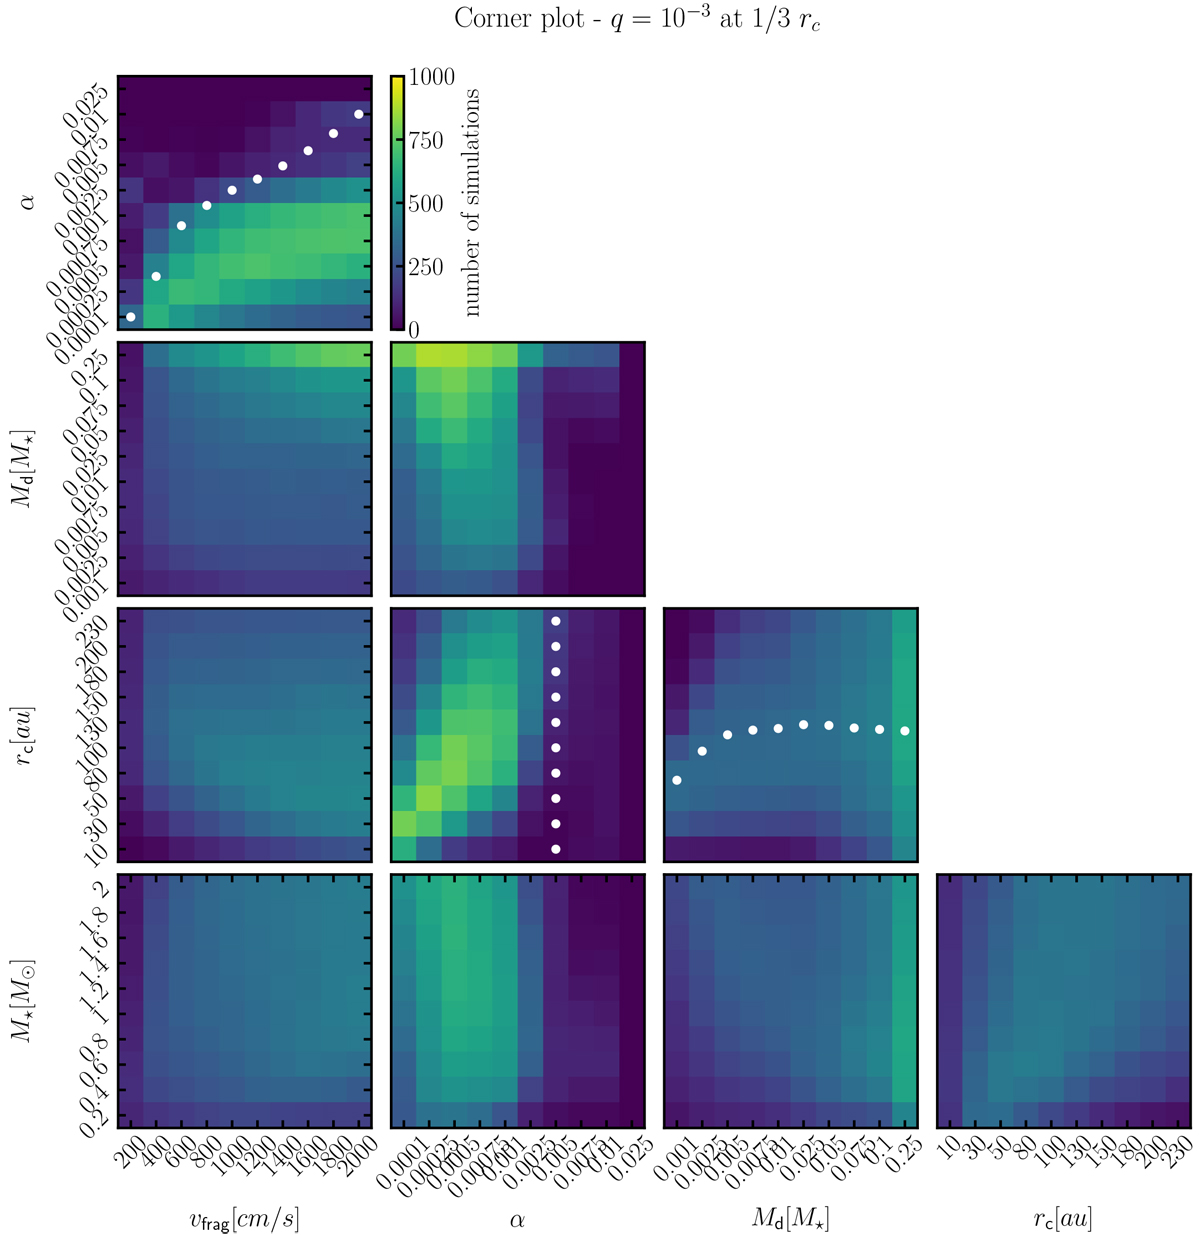
Fig. B.2
Download original image
Corner plot with a planet with of a planet/star mass ratio 10−3 at a location of the 1/3rc. From left to right: Fragmentation velocity υfrag[cm/s], turbulence a-value, disk mass Md[M*], characteristic radius rc[au]. From top to bottom: α, Md[M*], rc[au], M*[M⊙]. In the upper left plot the white dots show the track where the distinction between the fragmentation and the drift limited regime is. In the middle plot (rc − α) the white dots show the α-value where the pressure bump cannot hold the dust efficiently anymore. In the panel rc- Md, shown as white dots, is the mean value of the characteristic radius for every disk mass.
Current usage metrics show cumulative count of Article Views (full-text article views including HTML views, PDF and ePub downloads, according to the available data) and Abstracts Views on Vision4Press platform.
Data correspond to usage on the plateform after 2015. The current usage metrics is available 48-96 hours after online publication and is updated daily on week days.
Initial download of the metrics may take a while.