Fig. 10
Download original image
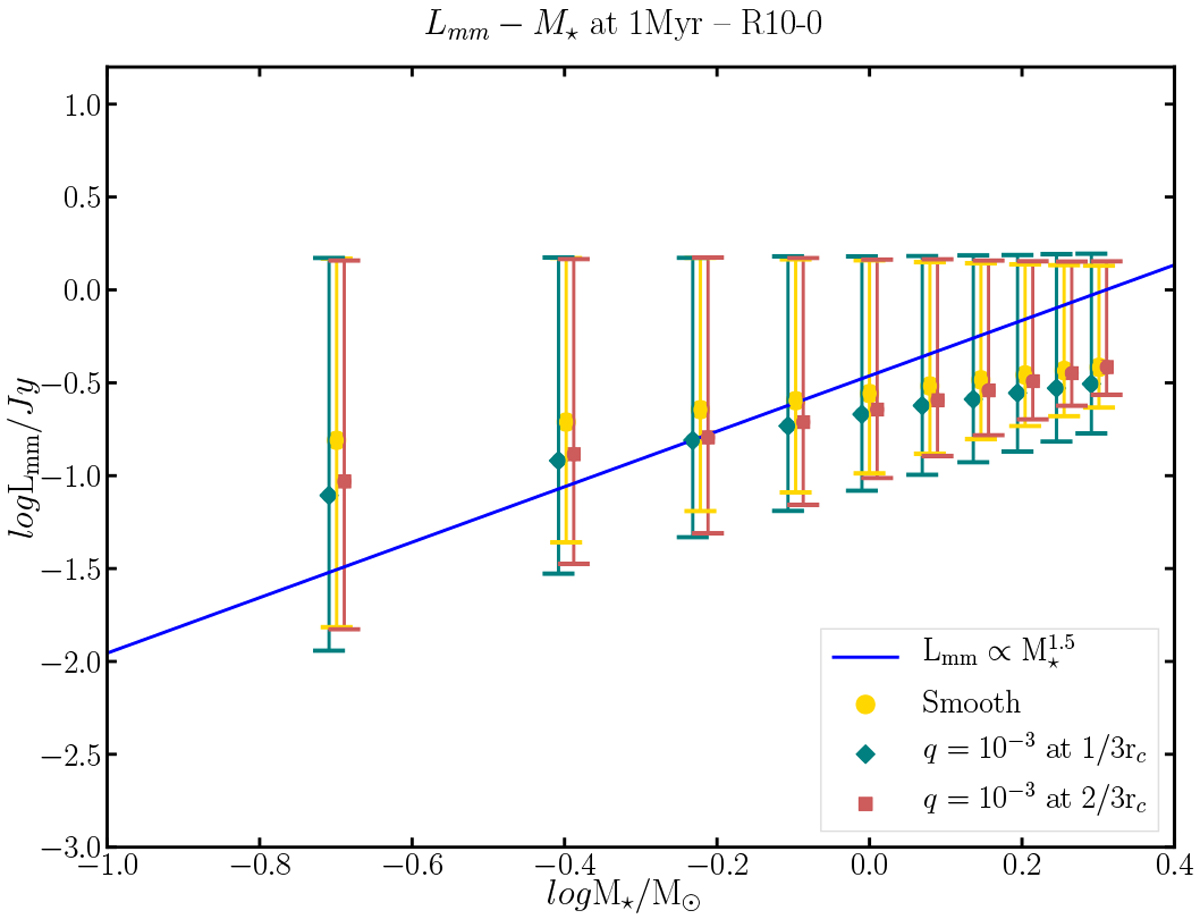
Lmm−M* relation at 1 Myr for three different cases for the matching simulations. Smooth case (yellow lines), a planet with planet/star mass ratio q = 10−3 at 1/3rc (green lines) and a planet with the same ratio at 2/3rc (red lines). The points define the median value of the luminosity at 1 Myr and the error bars are the 75% percentile from the upper and lower value. The blue line is the ![]() correlation from Andrews et al. (2018b).
correlation from Andrews et al. (2018b).
Current usage metrics show cumulative count of Article Views (full-text article views including HTML views, PDF and ePub downloads, according to the available data) and Abstracts Views on Vision4Press platform.
Data correspond to usage on the plateform after 2015. The current usage metrics is available 48-96 hours after online publication and is updated daily on week days.
Initial download of the metrics may take a while.