Fig. 1
Download original image
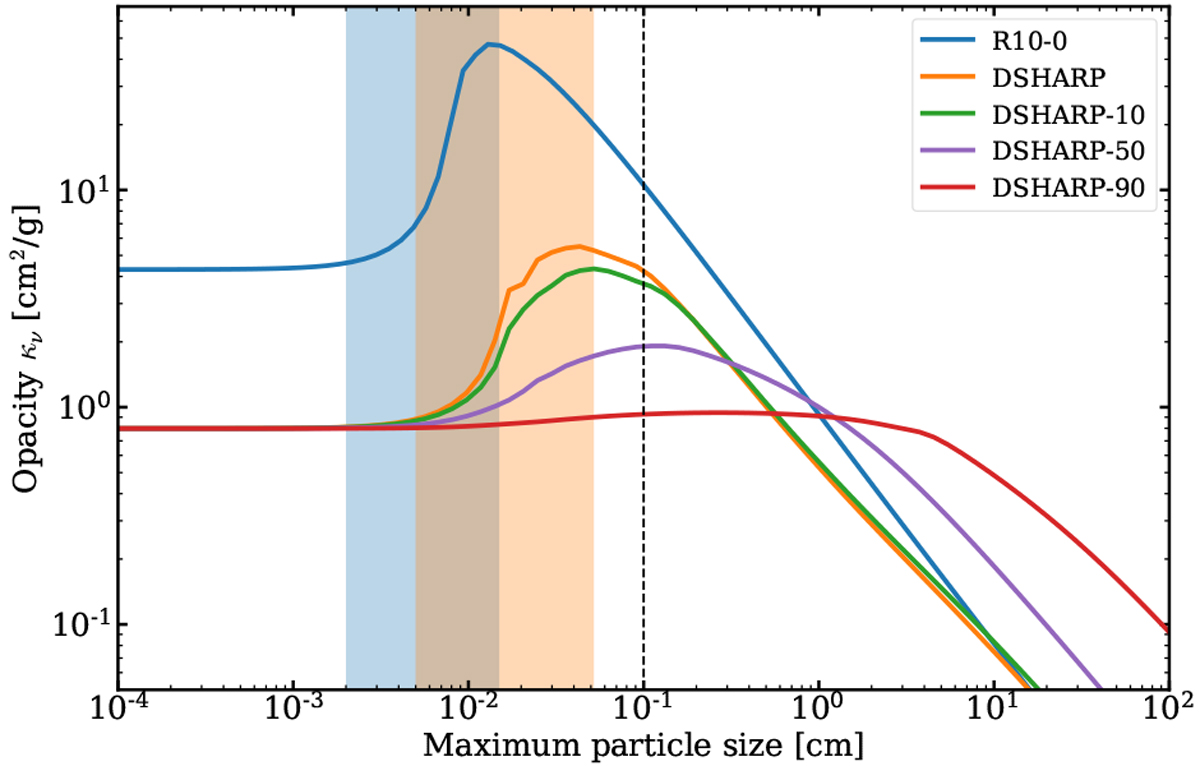
Comparison between the opacity models that we used at 850 µm as a function of the maximum particle size and for a power-law size distribution with an exponent of q = 2.5. Shown is the opacity cliff (see text for details) at a wavelength of 850 µm (blue and orange shaded regions). The blue line refers to the opacity model from Ricci et al. (2010) with compact grains (labeled R10-0) and the orange line to that of Birnstiel et al. (2018) with compact grains (labeled DSHARP). The green, purple, and red lines refer to 10%, 50%, and 90% porous grains in the DSHARP model. The R10-0 and DSHARP opacity values differ by a factor of ~8.5 at the position of the opacity cliff. As the porosity of the DSHARP model increases, the opacity cliff starts to flatten out, until it completely disappears for very porous grains (90%). The location of the cliff shifts to larger particle sizes as it diminishes in porosity. The black dashed line shows the particle size at 1 mm. The value for the R10-0 model at this size corresponds to ![]() , while for the DSHARP to
, while for the DSHARP to ![]() .
.
Current usage metrics show cumulative count of Article Views (full-text article views including HTML views, PDF and ePub downloads, according to the available data) and Abstracts Views on Vision4Press platform.
Data correspond to usage on the plateform after 2015. The current usage metrics is available 48-96 hours after online publication and is updated daily on week days.
Initial download of the metrics may take a while.