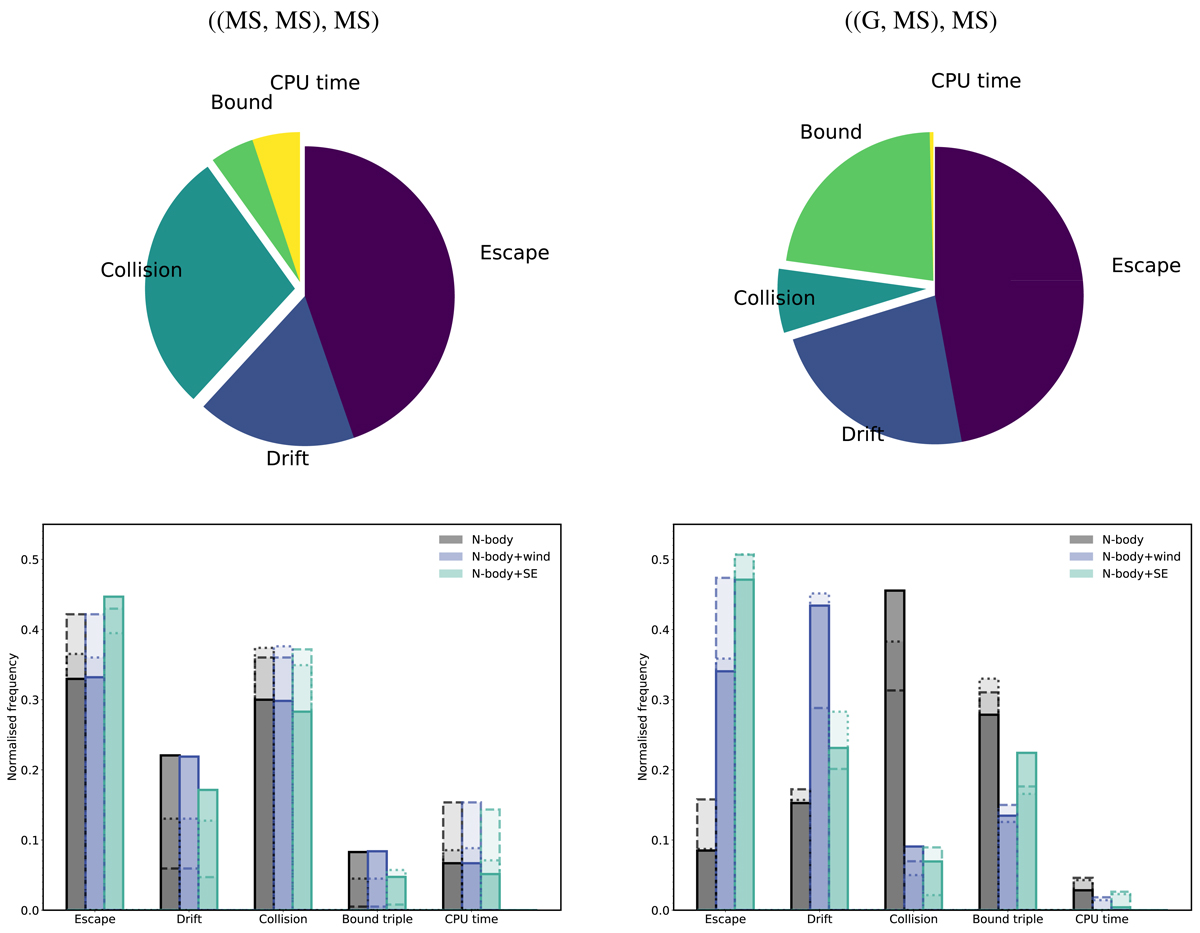
Fig. 5.
Download original image
Outcomes of the dynamically unstable phase for the full population of triples that become dynamically unstable during their evolution. Pie-charts represent the N-body simulations with stellar evolution for model OBin. The histograms show the outcomes for all models where different colours represent the different dynamical methods (Sect. 3.2). Solid, dashed, and dotted line styles represent the models for the initial population of triples OBin, T14 and E09, respectively. The results for each model are normalised to unity.
Current usage metrics show cumulative count of Article Views (full-text article views including HTML views, PDF and ePub downloads, according to the available data) and Abstracts Views on Vision4Press platform.
Data correspond to usage on the plateform after 2015. The current usage metrics is available 48-96 hours after online publication and is updated daily on week days.
Initial download of the metrics may take a while.