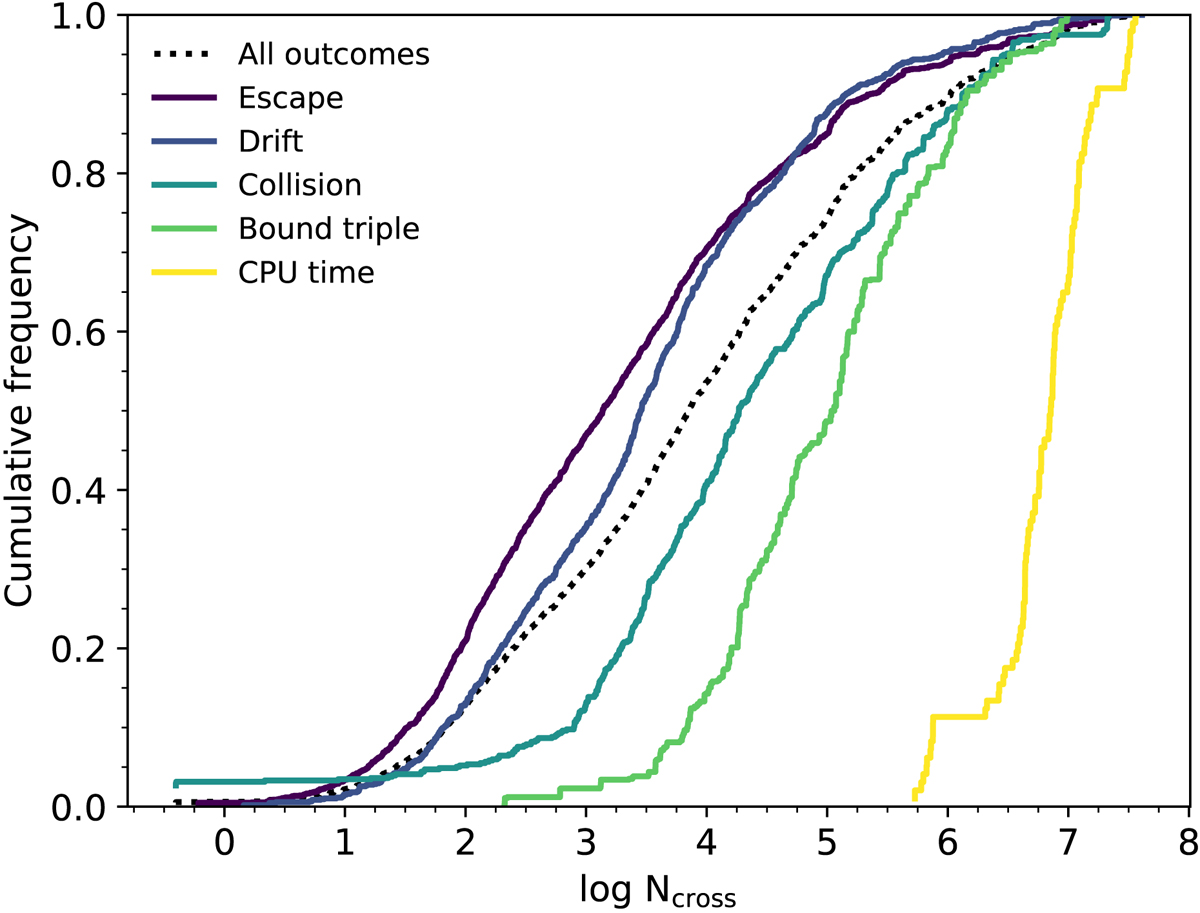
Fig. 4.
Download original image
Cumulative histogram of the duration of the dynamically unstable phase in crossing times (tdyn/tcross). The figures show that initially stable triples that have moved into the dynamically unstable regime can remain there for long times. The figure represents model OBin where the dynamics are modelled including stellar evolution. Other models show qualitatively similar behaviour.
Current usage metrics show cumulative count of Article Views (full-text article views including HTML views, PDF and ePub downloads, according to the available data) and Abstracts Views on Vision4Press platform.
Data correspond to usage on the plateform after 2015. The current usage metrics is available 48-96 hours after online publication and is updated daily on week days.
Initial download of the metrics may take a while.