Fig. D.1.
Download original image
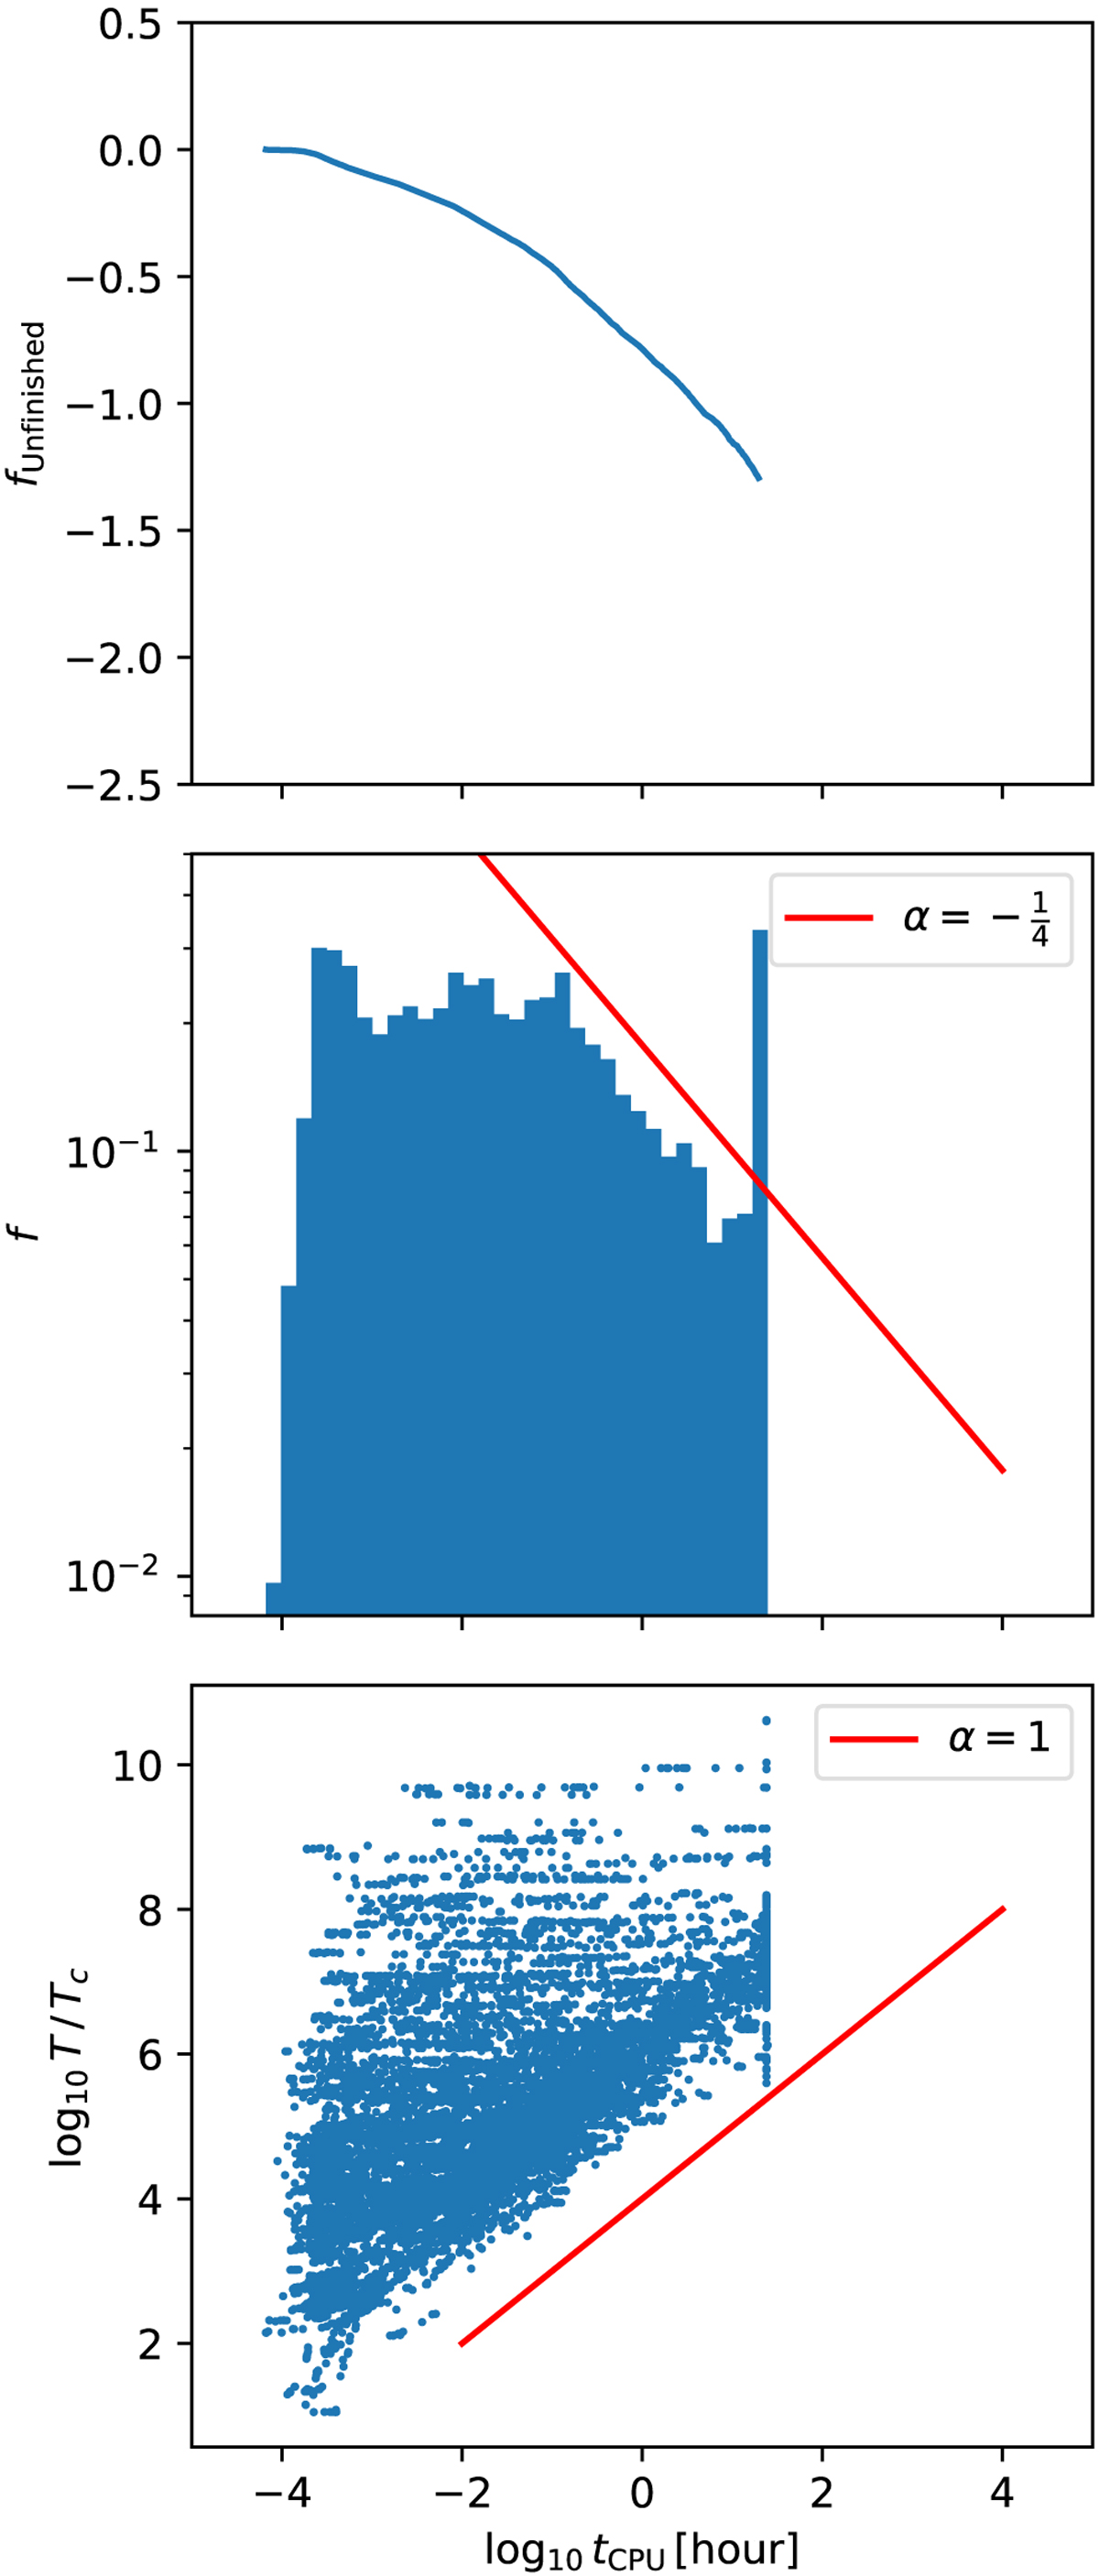
For the ensemble of triples which included full stellar evolution, we plot 1) the fraction of unfinished simulations vs. CPU time (top), 2) histogram of CPU times (middle), and 3) simulated physical time normalised by the crossing time vs. CPU time (bottom). The red lines represent estimates of the slopes in the data, with coefficient α.
Current usage metrics show cumulative count of Article Views (full-text article views including HTML views, PDF and ePub downloads, according to the available data) and Abstracts Views on Vision4Press platform.
Data correspond to usage on the plateform after 2015. The current usage metrics is available 48-96 hours after online publication and is updated daily on week days.
Initial download of the metrics may take a while.