Fig. 13.
Download original image
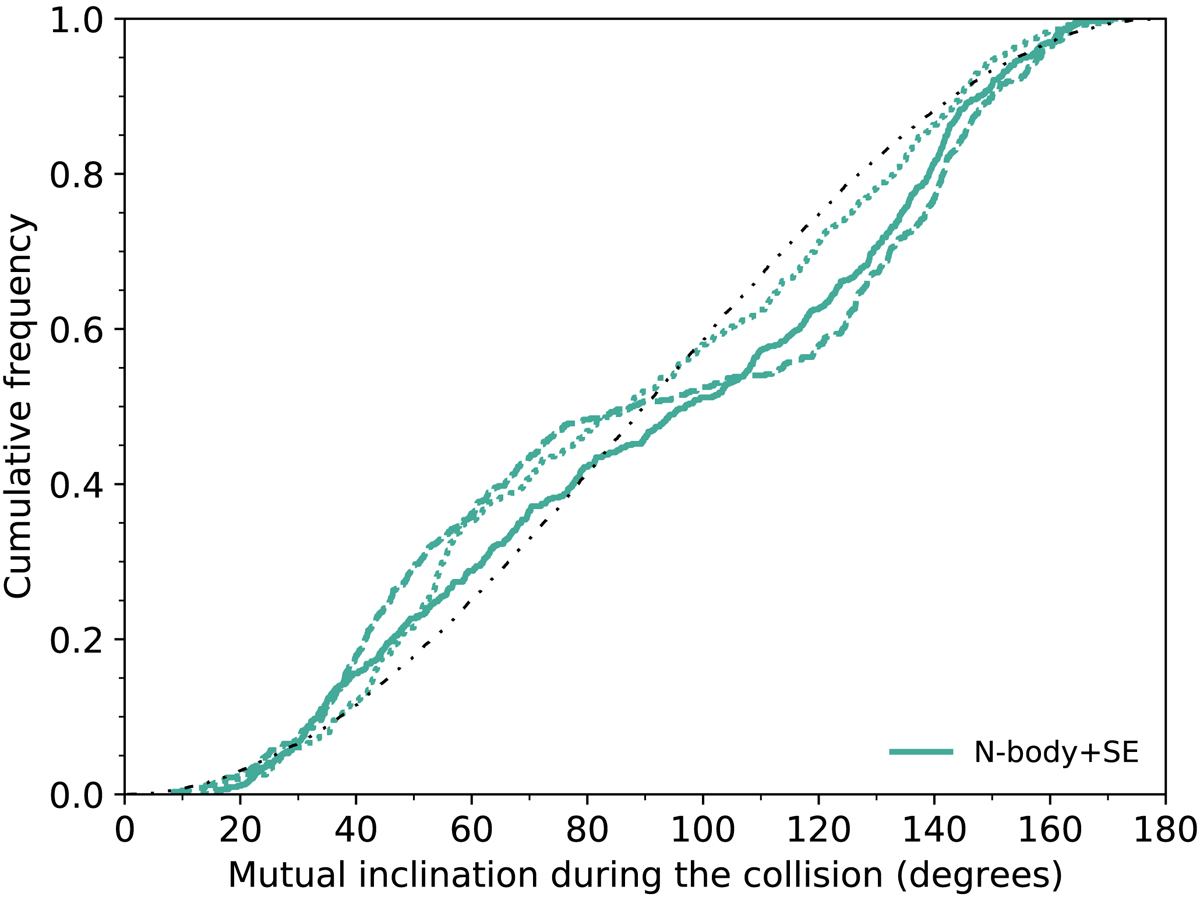
Distribution of inclinations at the time of the collisions. Green lines refer to the model where SE is included in the N-body simulations. Solid, dashed, and dotted line styles represent the initial population of triples of model OBin, T14 and E09, respectively. The black dashdotdotted line represents a random distribution in the cosine of the inclination.
Current usage metrics show cumulative count of Article Views (full-text article views including HTML views, PDF and ePub downloads, according to the available data) and Abstracts Views on Vision4Press platform.
Data correspond to usage on the plateform after 2015. The current usage metrics is available 48-96 hours after online publication and is updated daily on week days.
Initial download of the metrics may take a while.