Free Access
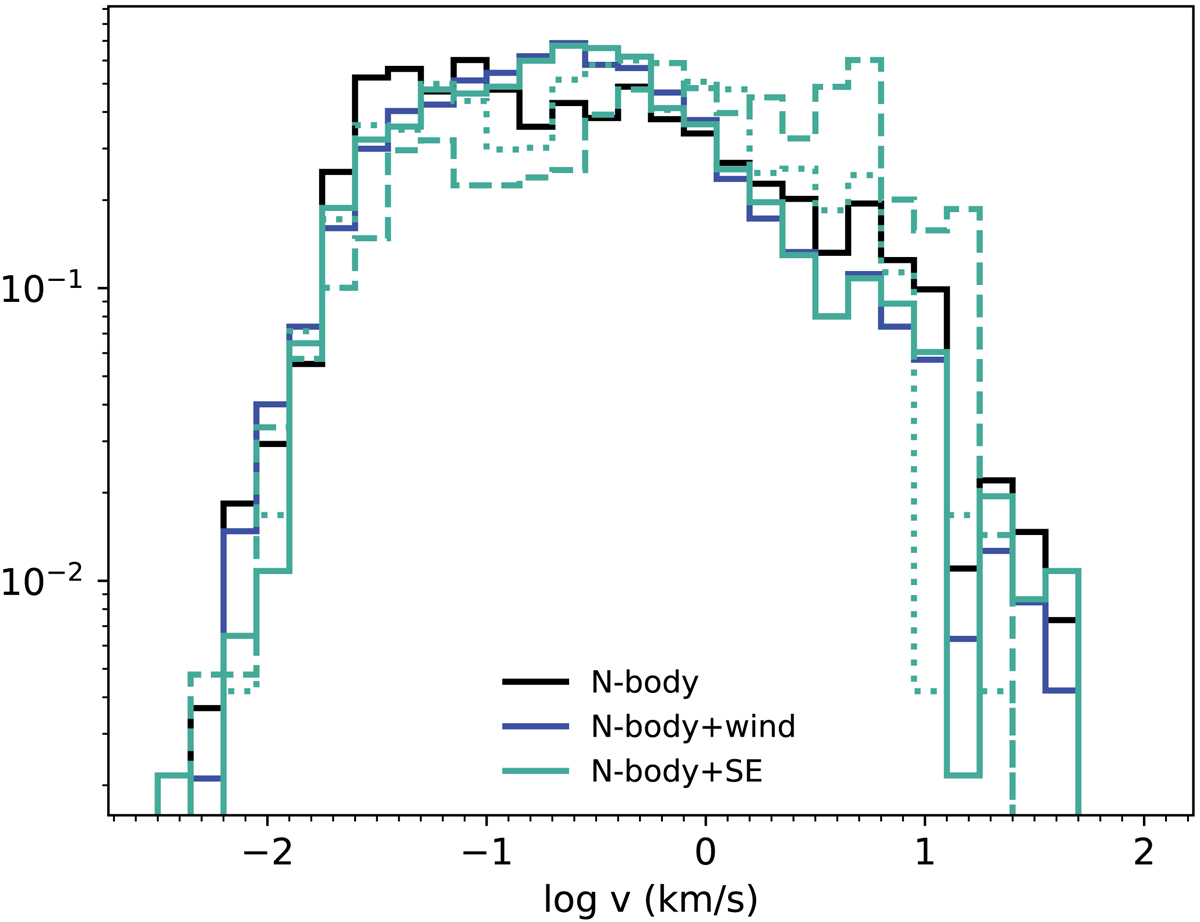
Fig. 12.
Download original image
Histogram of the escape velocities of the escaping stars relative to the binary for different models. Different colours represent the different dynamical modelling methods, different line styles represent the different models for the initial population of triples; OBin (solid), T14 (dashed), E09 (dotted).
Current usage metrics show cumulative count of Article Views (full-text article views including HTML views, PDF and ePub downloads, according to the available data) and Abstracts Views on Vision4Press platform.
Data correspond to usage on the plateform after 2015. The current usage metrics is available 48-96 hours after online publication and is updated daily on week days.
Initial download of the metrics may take a while.