Fig. 3.

Download original image
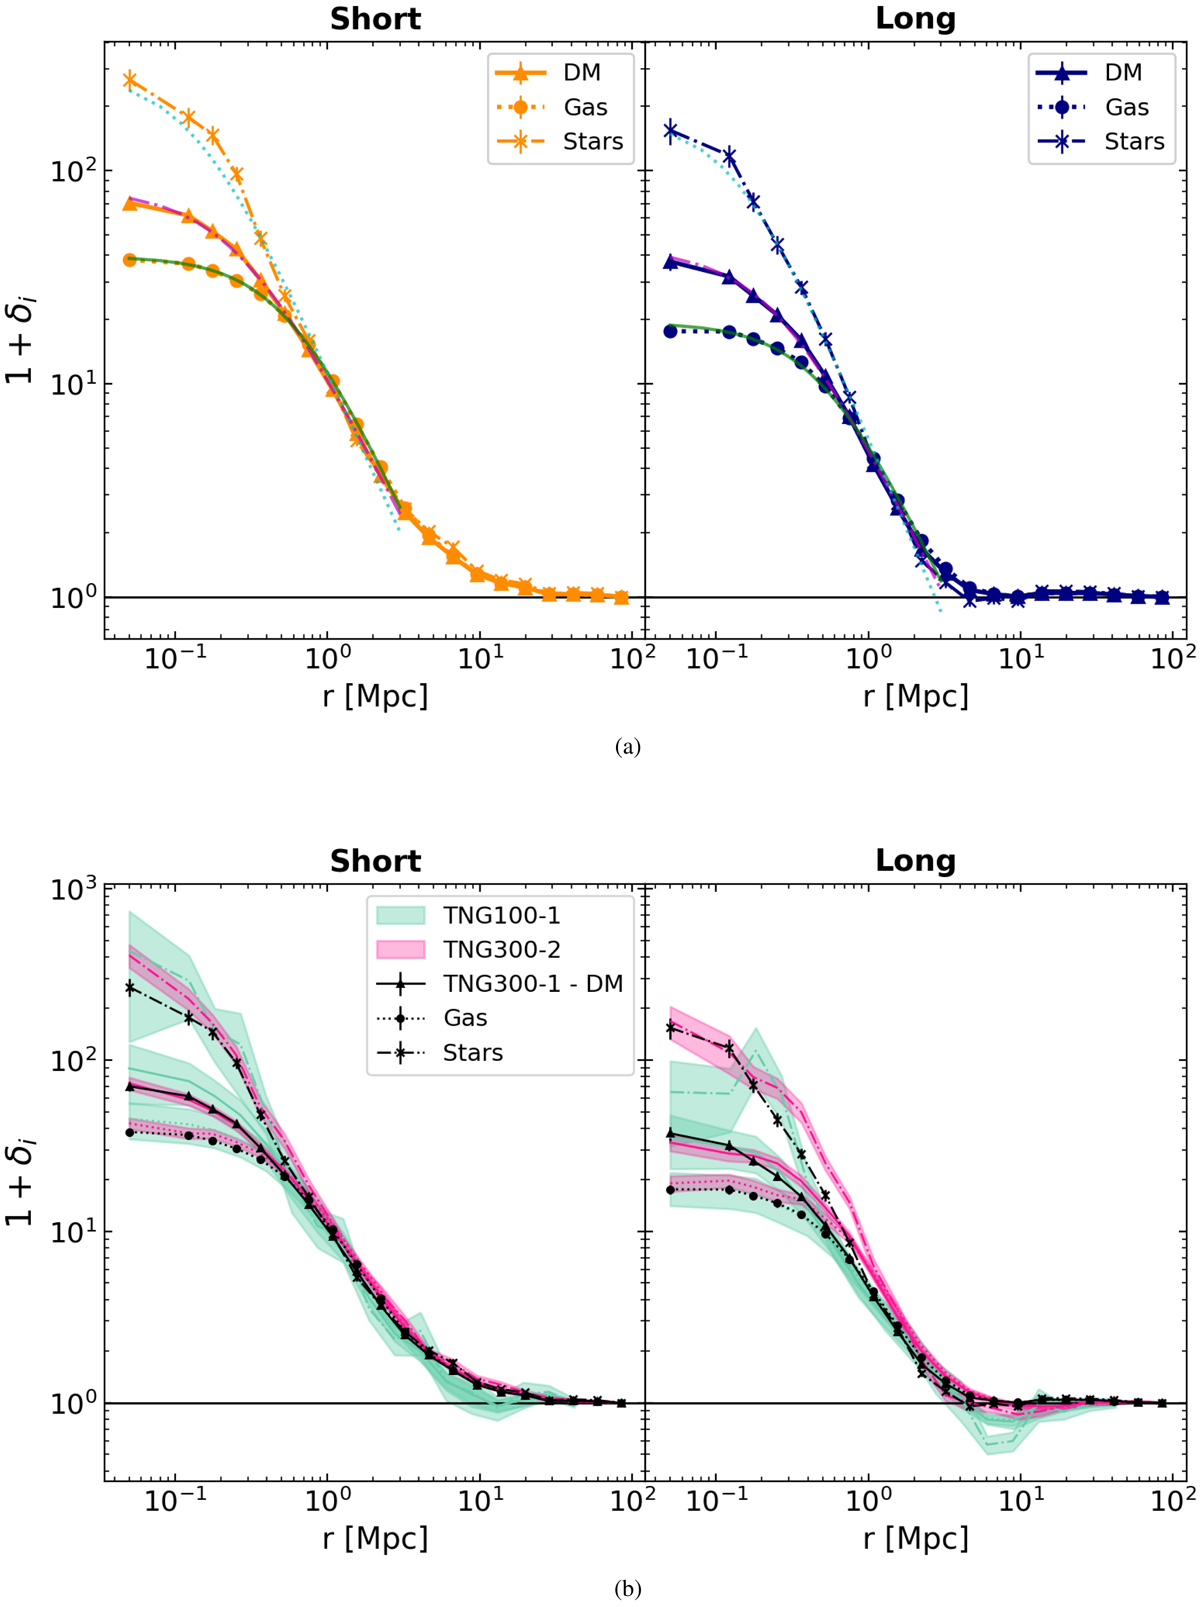
Top panel: radial profiles of the mean over-densities (Eq. (3)) of DM (solid lines with triangles), gas (dotted lines with circles), and stars (dash-dotted lines with crosses) for short and long filaments, respectively in orange and blue. The pink, green, and cyan lines denote respectively the fitting results of the DM, gas, and stellar profiles to the generalised β-model of Eq. (5) in the r < 3 Mpc range. Bottom panel: impact of the resolution of the simulation. The black curves correspond to the profiles obtained with the reference TNG300-1 simulation (same profiles as in Fig. 3a). Pink and green curves present respectively the results from the TNG300-2 (low resolution) and TNG100-1 (high resolution) boxes.
Current usage metrics show cumulative count of Article Views (full-text article views including HTML views, PDF and ePub downloads, according to the available data) and Abstracts Views on Vision4Press platform.
Data correspond to usage on the plateform after 2015. The current usage metrics is available 48-96 hours after online publication and is updated daily on week days.
Initial download of the metrics may take a while.


