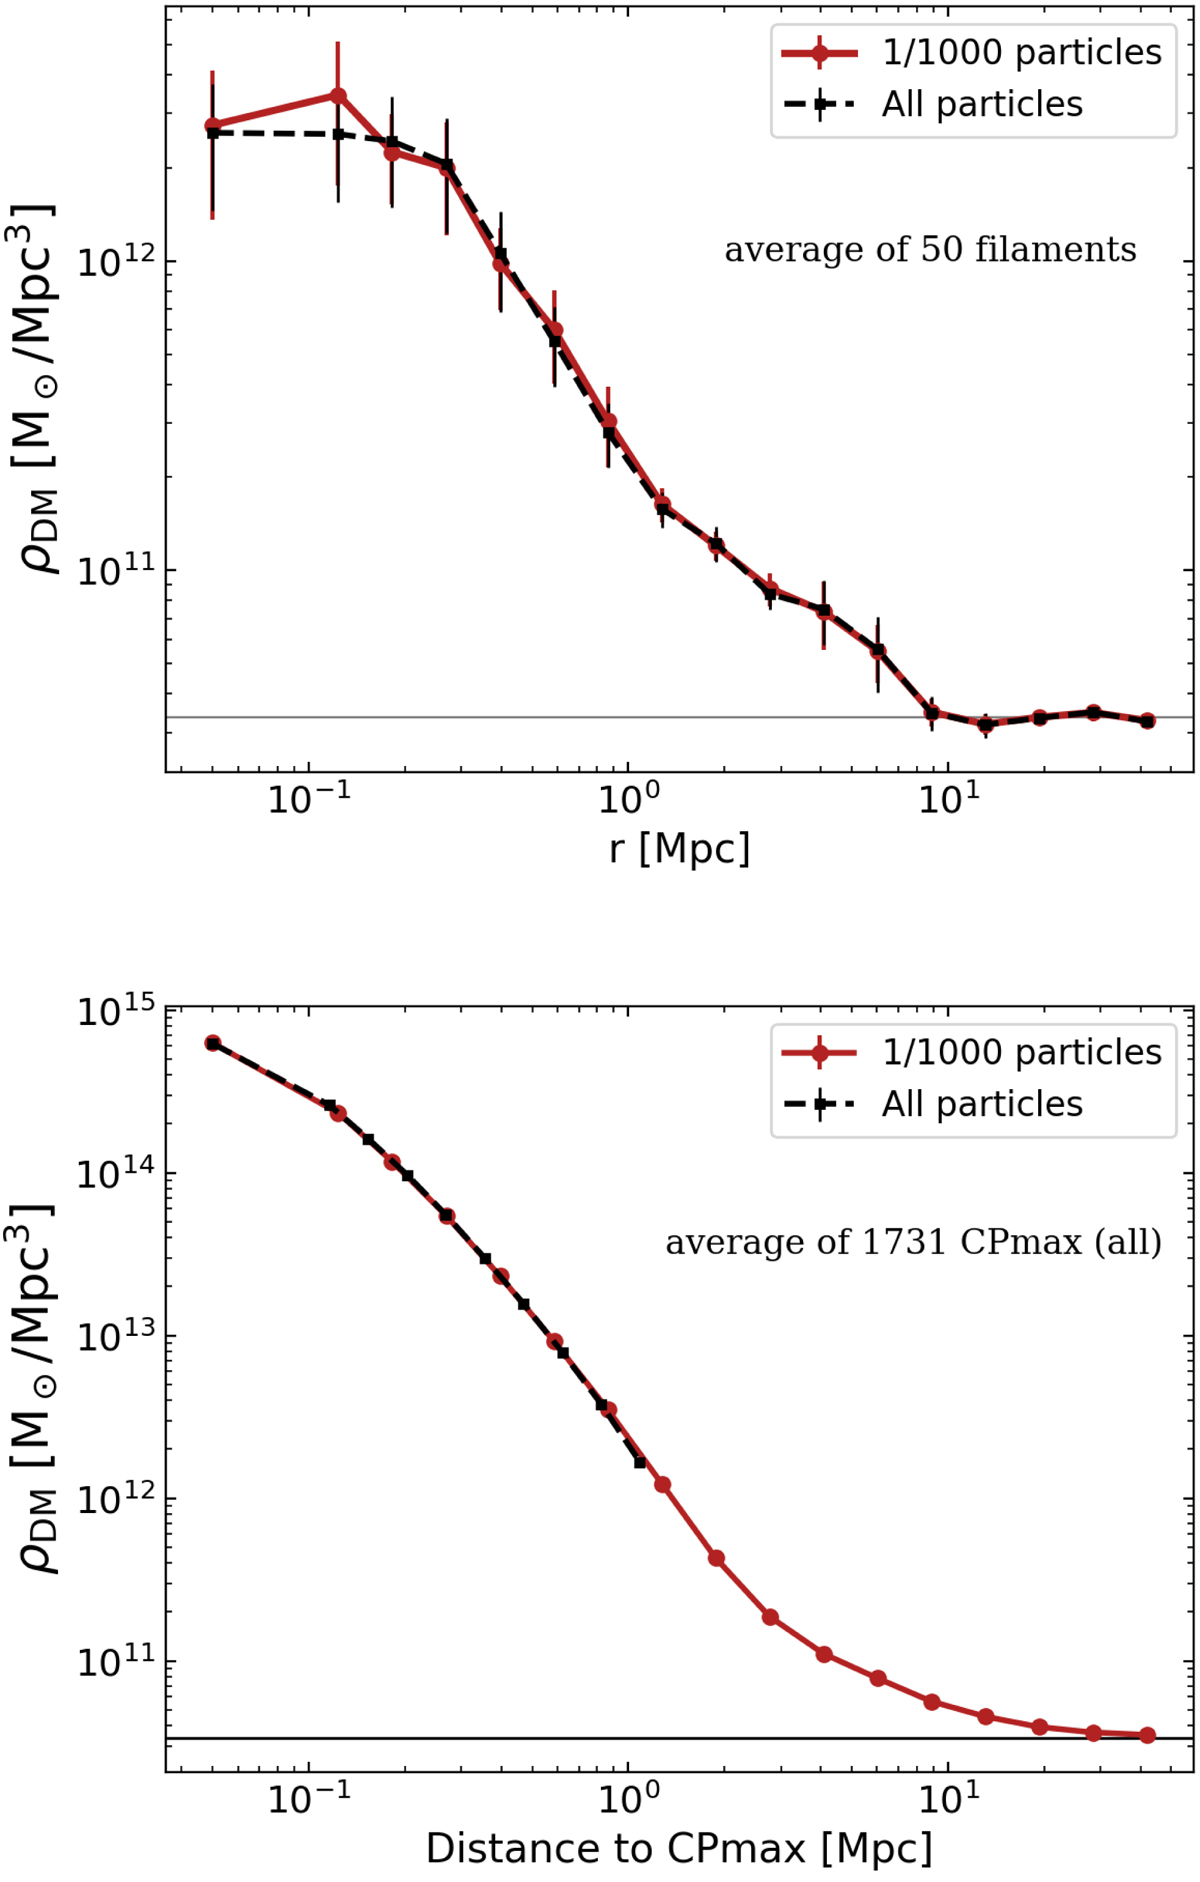
Fig. A.2.
Download original image
Mean DM density profiles around a set of 50 randomly selected filaments (top panel), and around all the DisPerSE CPmax points of the TNG300-1 simulation (bottom panel). The black dashed profiles correspond to those resulting from the full DM data set, while the red solid curves show the results derived from the fiducial sub-sampled DM data set (where one out of 1000 particles is randomly selected).
Current usage metrics show cumulative count of Article Views (full-text article views including HTML views, PDF and ePub downloads, according to the available data) and Abstracts Views on Vision4Press platform.
Data correspond to usage on the plateform after 2015. The current usage metrics is available 48-96 hours after online publication and is updated daily on week days.
Initial download of the metrics may take a while.