Fig. 13
Download original image
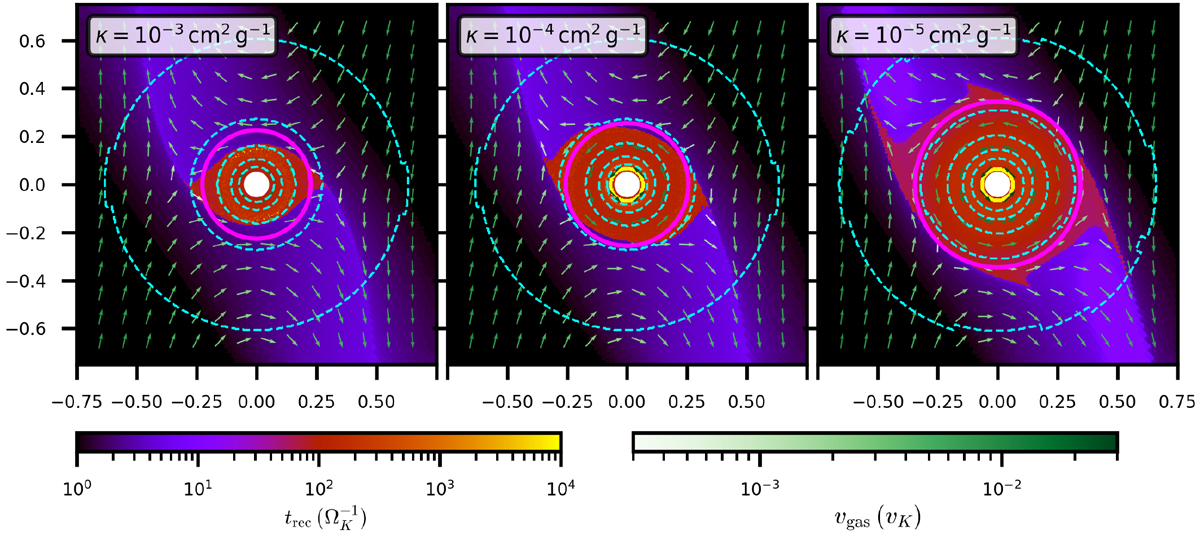
Recycling timescale measured using tracer particles for simulations with different opacities. The center panel is the M1 simulation, which uses our default opacity. After thermodynamic equilibrium is reached, tracer particles are integrated along streamlines backward in time. The measured time until they then escape the Hill sphere is the plotted recycling time. It measures for how long the gas has been inside the Hill sphere.
Current usage metrics show cumulative count of Article Views (full-text article views including HTML views, PDF and ePub downloads, according to the available data) and Abstracts Views on Vision4Press platform.
Data correspond to usage on the plateform after 2015. The current usage metrics is available 48-96 hours after online publication and is updated daily on week days.
Initial download of the metrics may take a while.