Fig. 4
Download original image
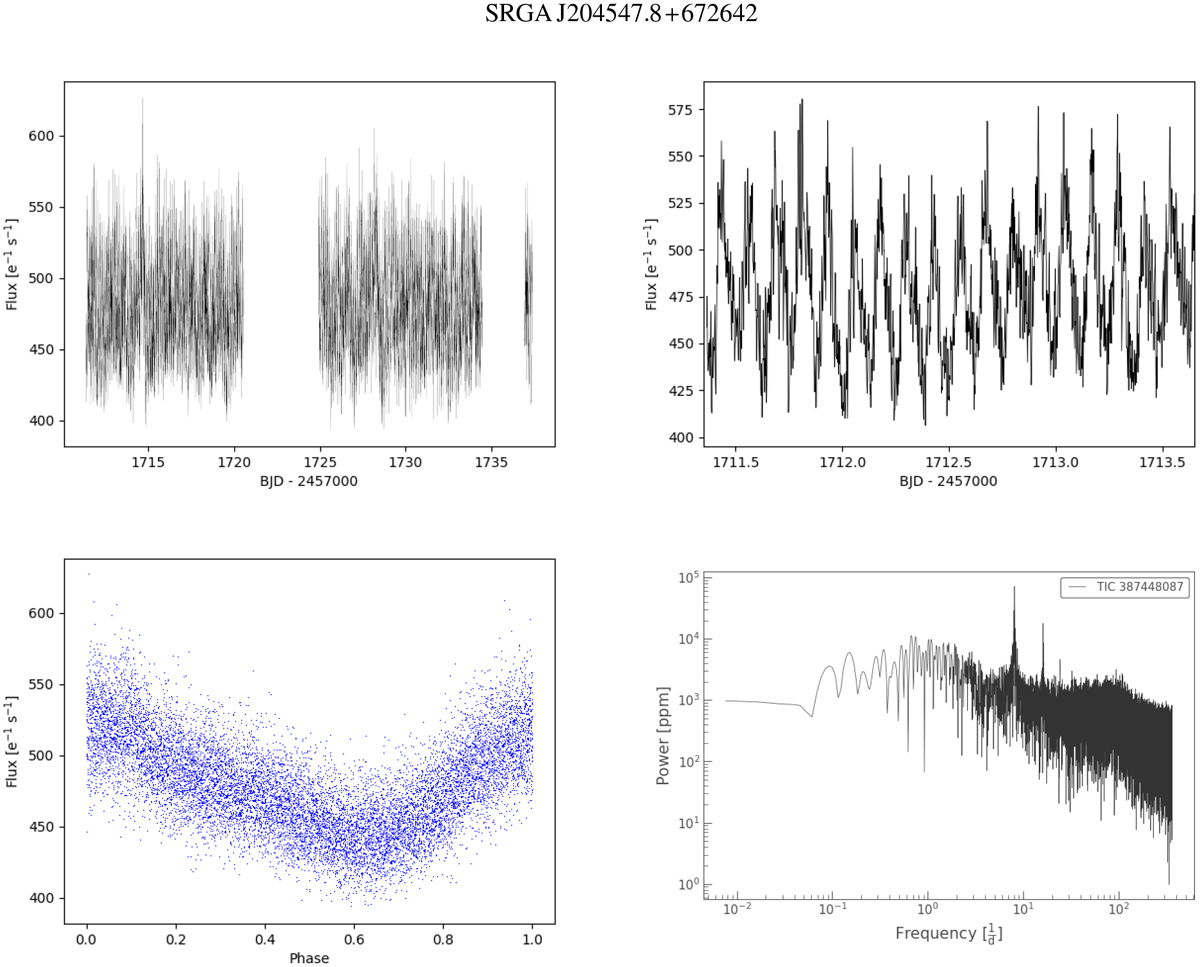
TESS observations of SRGA J204547.8+672642. Top row: light curves obtained in sector 15 (full data set on the left, and the first two days of observations on the right). Bottom left: light curve folded on the 2.98-h period. Bottom right: Lomb−Scargle periodogram.
Current usage metrics show cumulative count of Article Views (full-text article views including HTML views, PDF and ePub downloads, according to the available data) and Abstracts Views on Vision4Press platform.
Data correspond to usage on the plateform after 2015. The current usage metrics is available 48-96 hours after online publication and is updated daily on week days.
Initial download of the metrics may take a while.