Fig. 2
Download original image
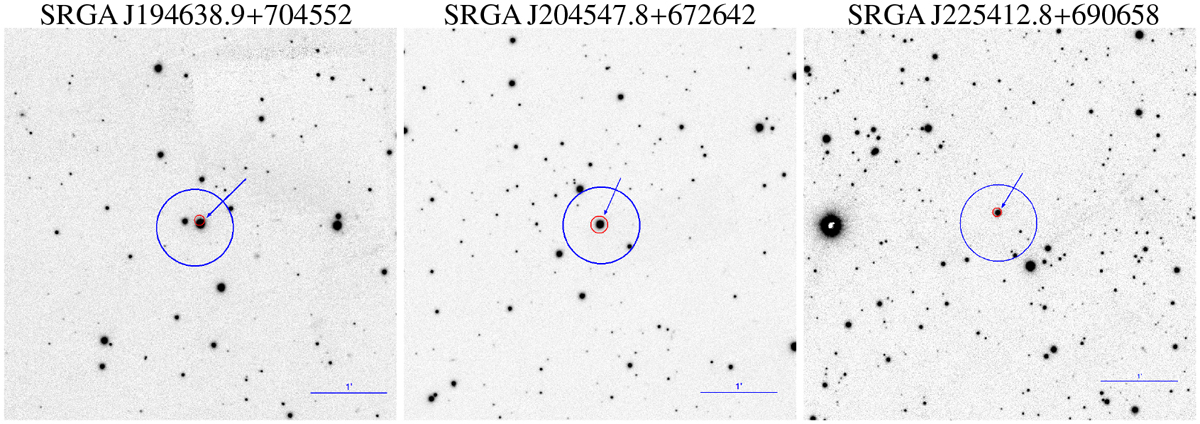
Pan-STARRS1 images in the r filter around SRGA J194638.9+704552 (left), SRGA J204547.8+672642 (middle), and SRGAJ225412.8+690658 (right). The size of each image is 5′ × 5′. The blue circle with a radius of 30″ indicates the ART-XC location. The red circle shows the eROSITA 98% location region. The optical counterpart is indicated by the arrow.
Current usage metrics show cumulative count of Article Views (full-text article views including HTML views, PDF and ePub downloads, according to the available data) and Abstracts Views on Vision4Press platform.
Data correspond to usage on the plateform after 2015. The current usage metrics is available 48-96 hours after online publication and is updated daily on week days.
Initial download of the metrics may take a while.