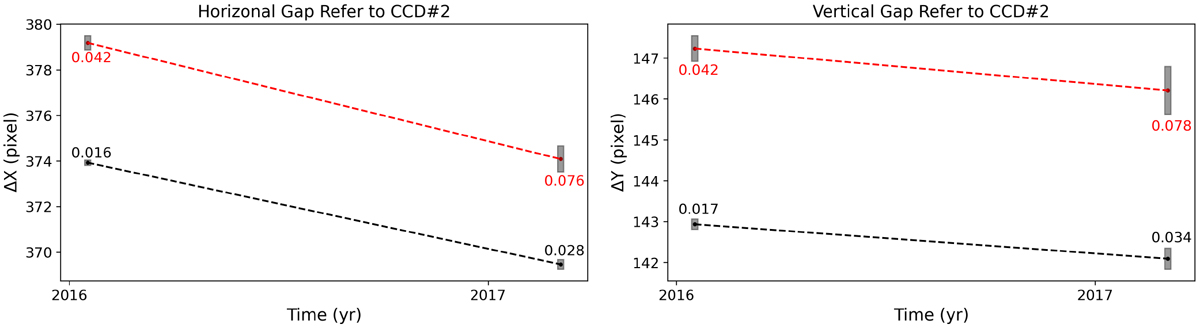
Fig. 20
Download original image
Averages and precisions (σ) of the gap in the horizontal and vertical directions as a function of time, when CCD#2 is taken as reference. We note that the gaps of 2016 are based on measurements with the DES r filter and the gaps of 2017 are based on measurements with the SDSS g filter. The black points represent the results derived from the proposed method in this paper, and the red points represent the results derived from the AK03 method. The shaded bars indicate a ±σ x 15 (for clarity) interval around the mean gap location. The values of σ are shown in the panel.
Current usage metrics show cumulative count of Article Views (full-text article views including HTML views, PDF and ePub downloads, according to the available data) and Abstracts Views on Vision4Press platform.
Data correspond to usage on the plateform after 2015. The current usage metrics is available 48-96 hours after online publication and is updated daily on week days.
Initial download of the metrics may take a while.