Fig. 1
Download original image
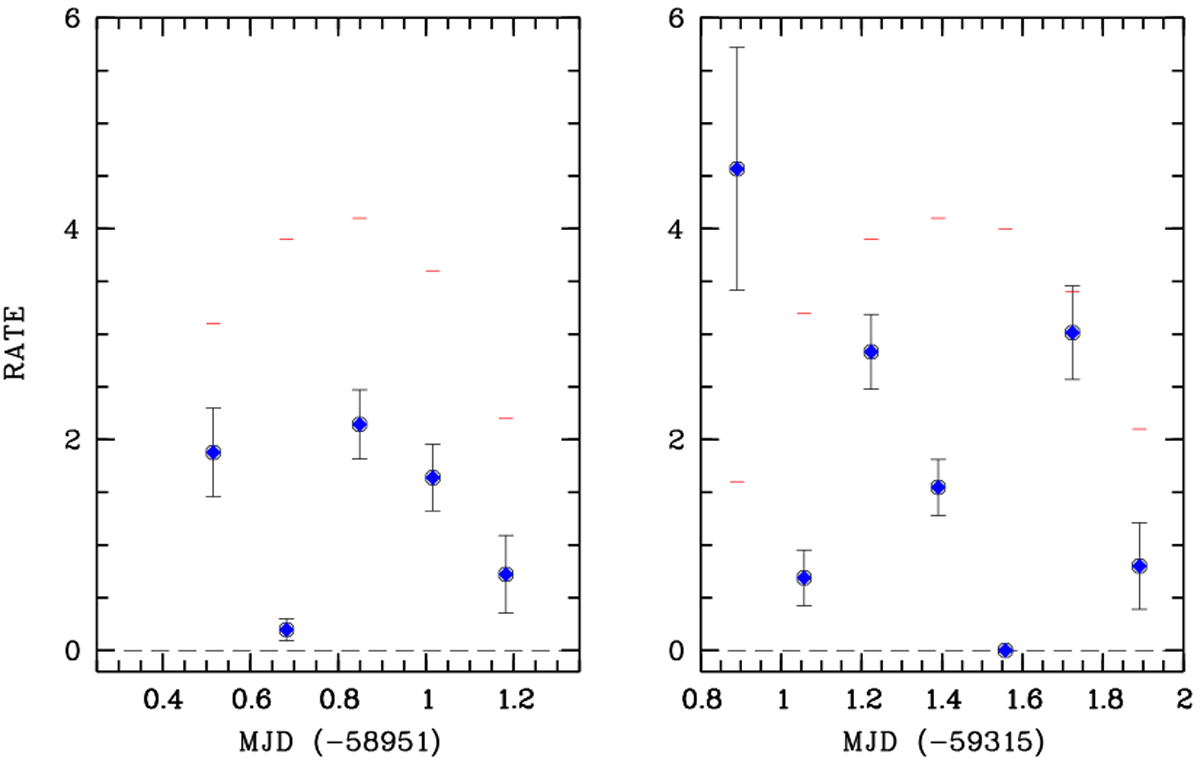
Full-band eRASSl and eRASS3 X-ray light curves (0.2–10 keV). Shown are the vignetting-corrected mean rates per eRODAY with blue symbols. The exposure time per eRODAY is indicated with short red dashes (divided by a factor 10).
Current usage metrics show cumulative count of Article Views (full-text article views including HTML views, PDF and ePub downloads, according to the available data) and Abstracts Views on Vision4Press platform.
Data correspond to usage on the plateform after 2015. The current usage metrics is available 48-96 hours after online publication and is updated daily on week days.
Initial download of the metrics may take a while.