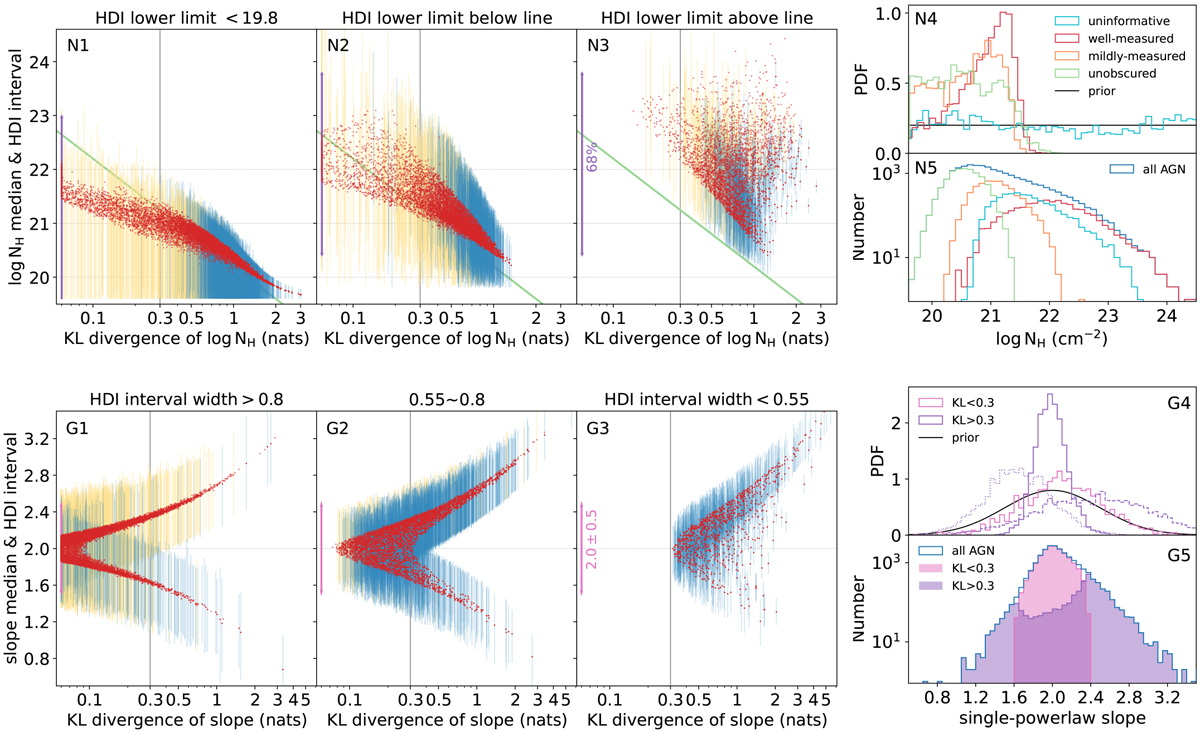
Fig. 9
Download original image
Distributions of the posterior median and 1-σ HDI interval as a function of KL divergence for NH (panels N1~N3) and for power-law slope Γ (G1~G3), respectively, as measured using the single-powerlaw model. Examples of source posterior PDF are compared with the prior PDF for NH (N4) and for Γ (G4). The distributions of posterior median values are also displayed for NH (N5) and Γ (G5), respectively. The HDI intervals are plotted as blue error bars for the sources with at least 30 net counts and yellow error bars for the other faint sources. For representation, we only plot the yellow error bars for a random 10% of these faint sources. In panels N1~N3, the AGN catalog is plotted separately in three groups, i.e., N1: sources with the HDI lower limit truncated by the boundary (<19.8); N2 and N3: other sources with the HDI lower limit below and above the green line, which corresponds to logNH = 20.2–2 log KLNH. In panels G1~G3, the catalog is also divided into three, i.e., sources with HDI interval width >0.8 (G1), between 0.55 and 0.8 (G2), and <0.55 (G3). The purple arrowed lines indicate 68% of the NH parameter range at one side of the boundary (N1) or at the center of the range (N2, N3). The magenta arrowed lines indicate the 68% range of the Gaussian(2.0,0.5) prior for Γ. In panels N5 and G5, the blue empty histograms indicate the whole AGN sample; the cyan, green, orange, and red colors indicate the four classes of NH measurements, i.e., 1) uninformative, 2) unobscured, 3) mildly-measured, and 4) well-measured; the purple and magenta colors indicate sources with KLΓ above and below 0.3. In panels N4 and G4, the black lines indicate the prior PDFs; the IDs of example sources for NH PDF are 878 (cyan), 4526 (green), 20 (orange), and 7274 (red); the ID of example sources for Γ PDF are 864 (magenta), 13651 (purple, dashed), 595 (purple, dotted), and 471 (purple, solid).
Current usage metrics show cumulative count of Article Views (full-text article views including HTML views, PDF and ePub downloads, according to the available data) and Abstracts Views on Vision4Press platform.
Data correspond to usage on the plateform after 2015. The current usage metrics is available 48-96 hours after online publication and is updated daily on week days.
Initial download of the metrics may take a while.