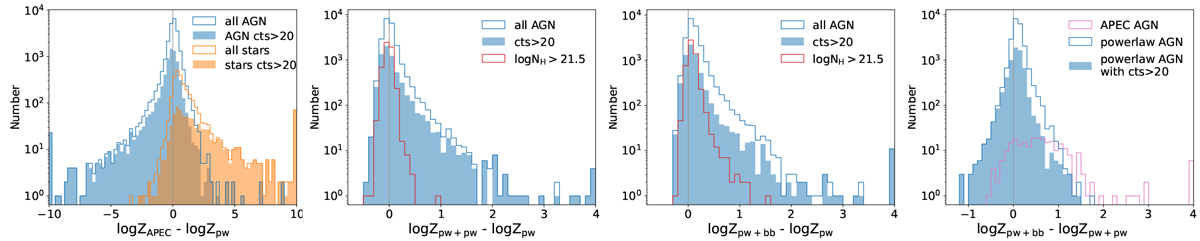
Fig. 8
Download original image
Model comparison on the basis of Δ log Z between pairs of models, i.e., 1) the single-powerlaw (pw) model vs the APEC model; 2) the double-powerlaw (pw+pw) model vs the single-powerlaw model; 3) the powerlaw + blackbody (pw+bb) model vs the single-powerlaw model; 4) the powerlaw + blackbody model vs the double-powerlaw model. The empty histogram indicates all the sources and the filled histogram corresponds to the subsamples of bright sources with at least 20 net counts in 0.2–5 keV band. In the first panel, the blue and orange colors indicate AGN and stars respectively. In the second and third panels, the red color indicates the subsamples of AGN with a median logNH above 21.5. In the last panel, the blue and magenta colors indicate sources with log Zapec − log ZpW below and above 1.3 respectively.
Current usage metrics show cumulative count of Article Views (full-text article views including HTML views, PDF and ePub downloads, according to the available data) and Abstracts Views on Vision4Press platform.
Data correspond to usage on the plateform after 2015. The current usage metrics is available 48-96 hours after online publication and is updated daily on week days.
Initial download of the metrics may take a while.