Fig. 5
Download original image
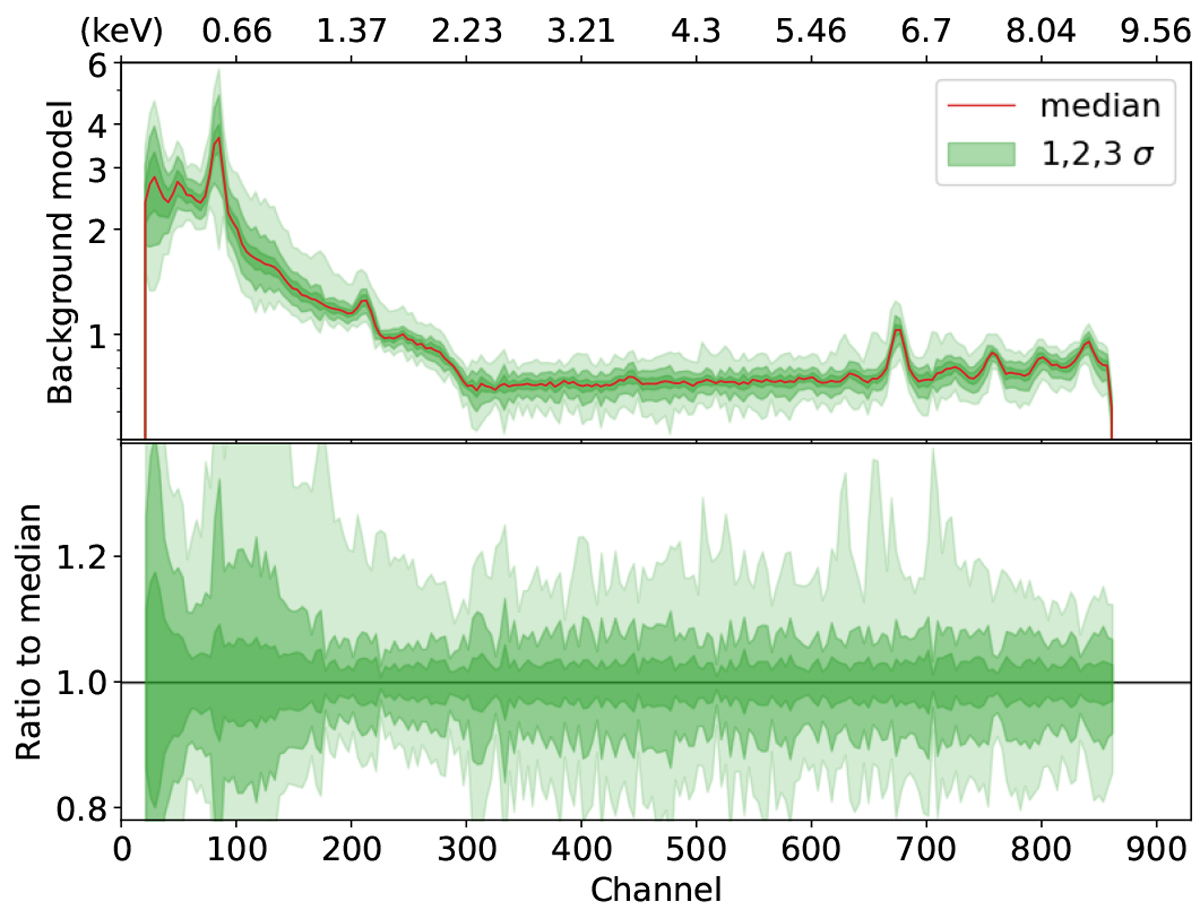
Background model normalized to a mean value of 1. The red line displays the median of the models of all the sources, and the three-level green shaded regions indicate the 1,2, and 3 σ percentiles. The lower panel displays the ratio to the median.
Current usage metrics show cumulative count of Article Views (full-text article views including HTML views, PDF and ePub downloads, according to the available data) and Abstracts Views on Vision4Press platform.
Data correspond to usage on the plateform after 2015. The current usage metrics is available 48-96 hours after online publication and is updated daily on week days.
Initial download of the metrics may take a while.