Fig. 2
Download original image
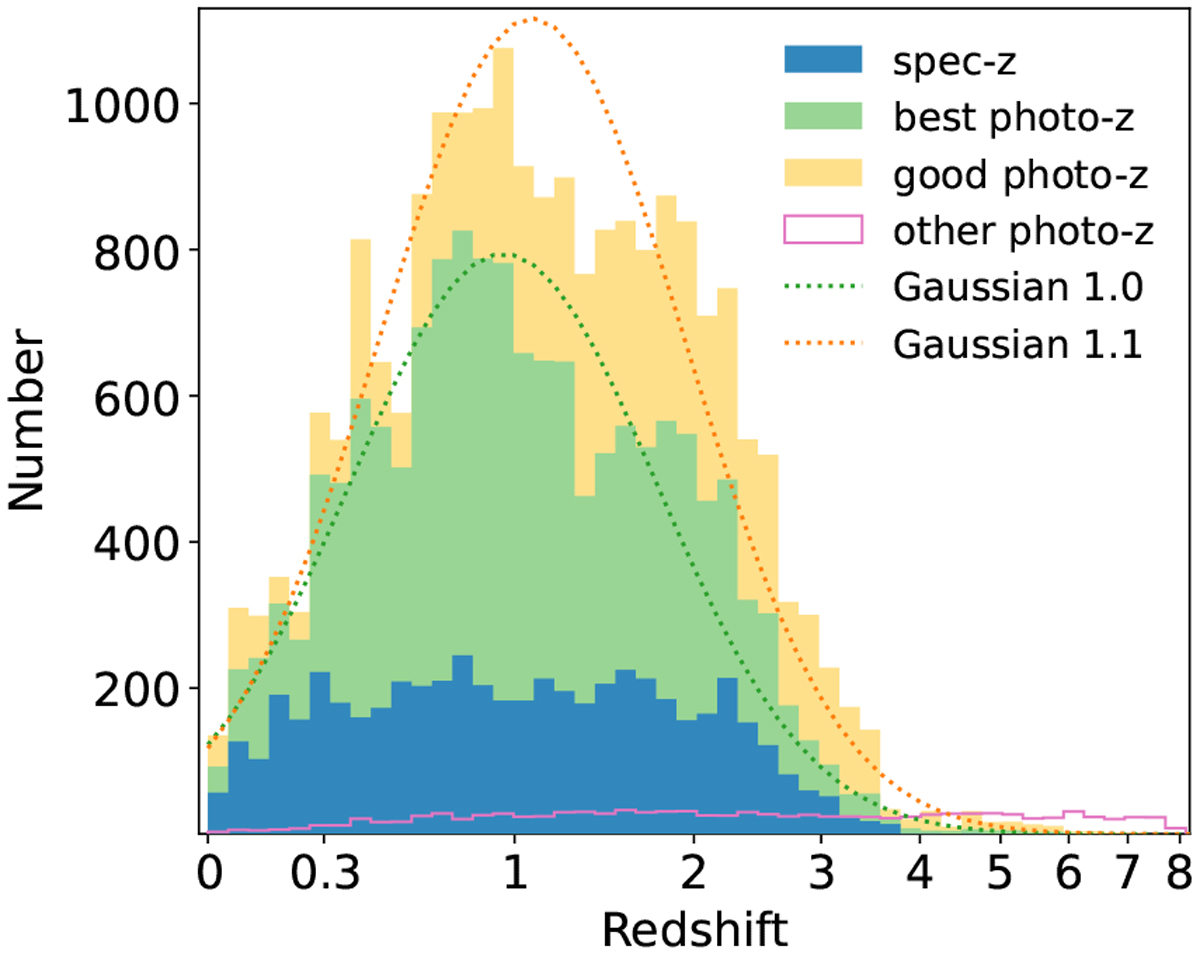
Stacked filled histograms: redshift distributions of the eFEDS AGN with spec-z (5287; zG = 5; in blue), with best photo-z (9643; zG = 4; in green), and with good photo-z (6057; zG = 3; in yellow), respectively. The other AGN (1092; zG <3) are displayed in the magenta empty histogram. For sources with photo-z, the redshift PDF is used in plotting. For comparison, we plot the Gaussian distributions centered at z = 1.0 (green dotted line) and z = 1.1 (orange dotted line), which are normalized to the number of AGN with best redshift measurements (zG ⩾4) and good measurements (zG ⩾3), respectively. Both of them have σ = 0.15 in the space of log(l + z).
Current usage metrics show cumulative count of Article Views (full-text article views including HTML views, PDF and ePub downloads, according to the available data) and Abstracts Views on Vision4Press platform.
Data correspond to usage on the plateform after 2015. The current usage metrics is available 48-96 hours after online publication and is updated daily on week days.
Initial download of the metrics may take a while.