Fig. 19
Download original image
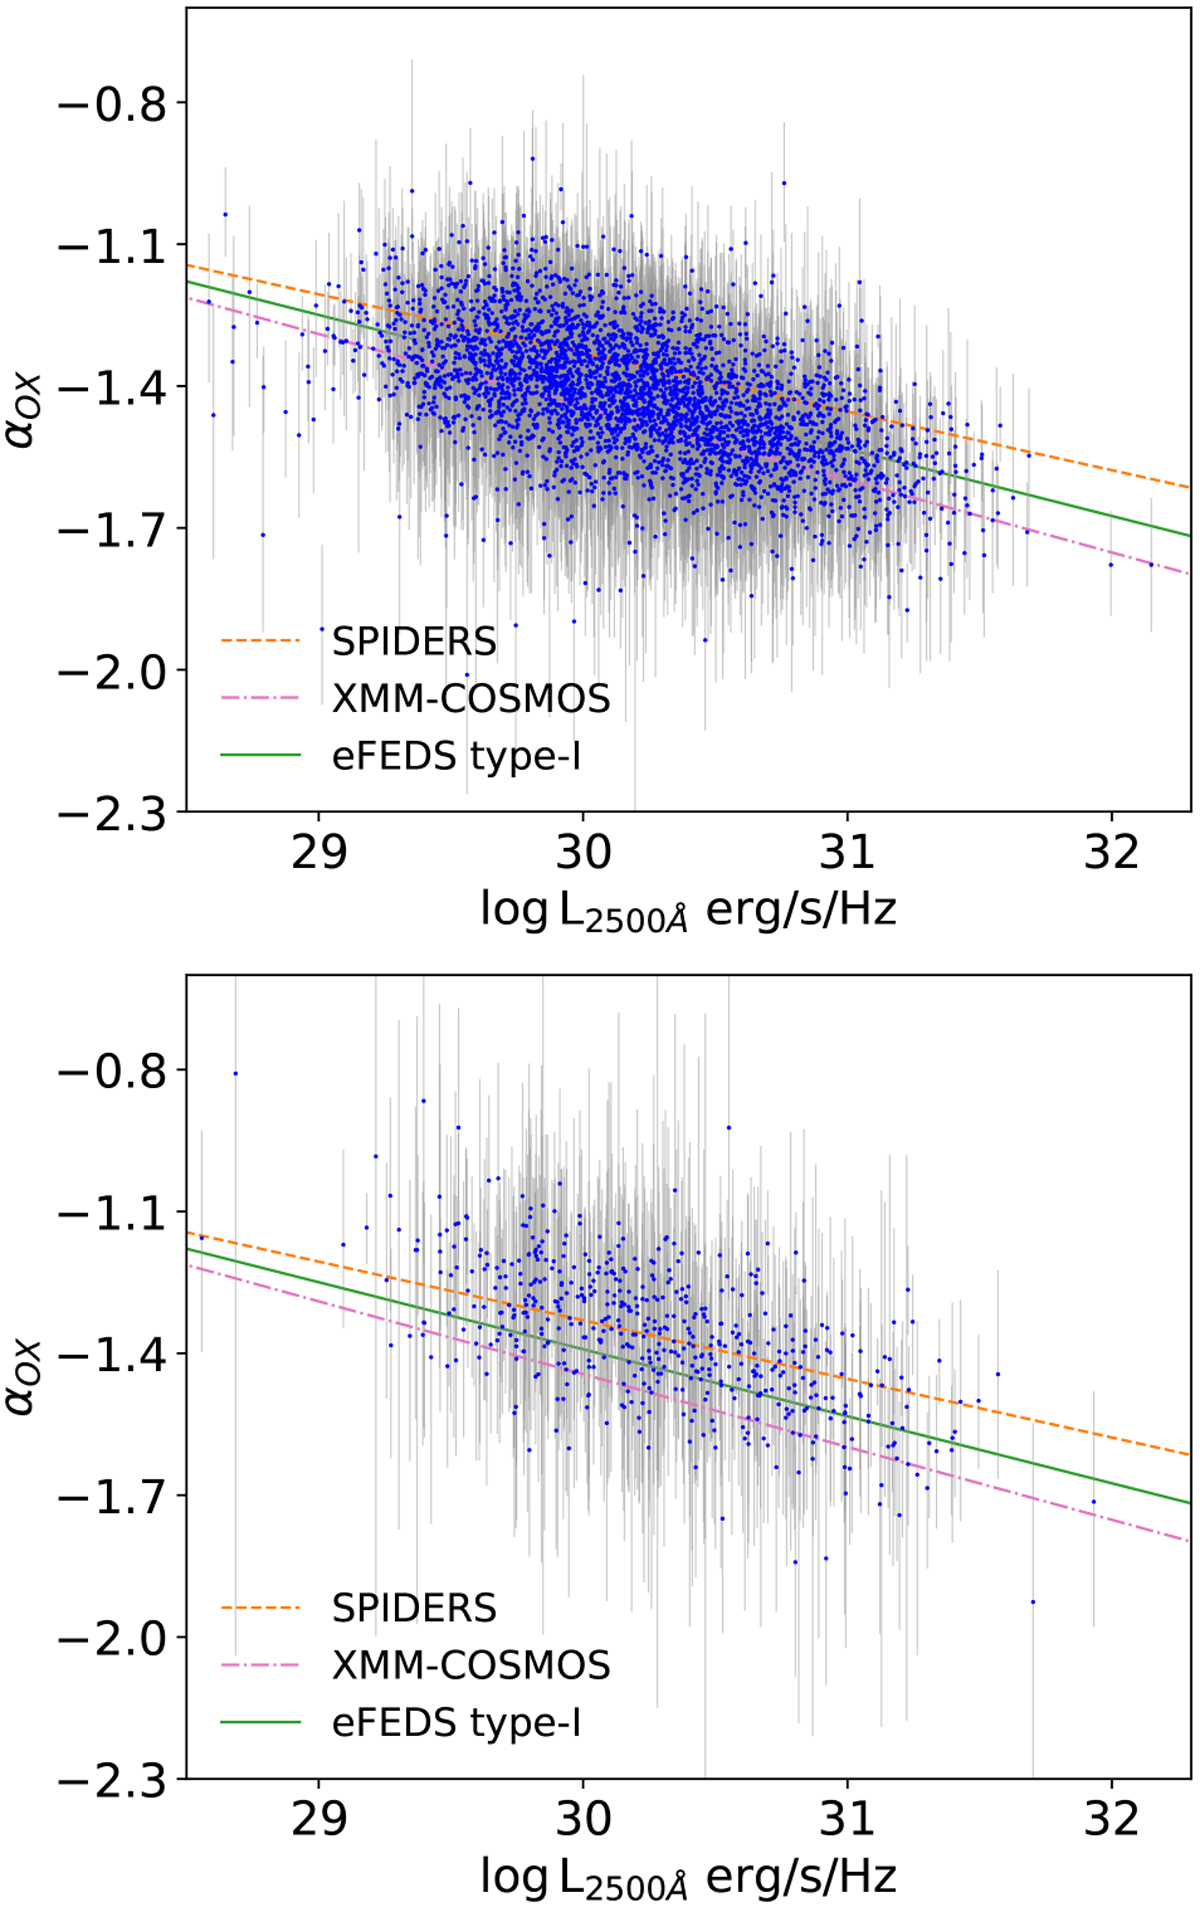
αOX–L2500 scatter plots of the X-ray unobscured (upper panel) and obscured (lower) blue AGN. The green solid line (αOX = 2.840.14 log L2500) is based on the eFEDS type-I subsample (upper panel); the orange dashed line (αOX = 2.39–0.124 log L2500) is measured from the SPIDERS AGN catalog (Coffey et al. 2019); the magenta dash-dotted line (αOX = 3.176–0.154 log L2500) is from the XMM-COSMOS AGN catalog (Lusso et al. 2010).
Current usage metrics show cumulative count of Article Views (full-text article views including HTML views, PDF and ePub downloads, according to the available data) and Abstracts Views on Vision4Press platform.
Data correspond to usage on the plateform after 2015. The current usage metrics is available 48-96 hours after online publication and is updated daily on week days.
Initial download of the metrics may take a while.