Fig. 18
Download original image
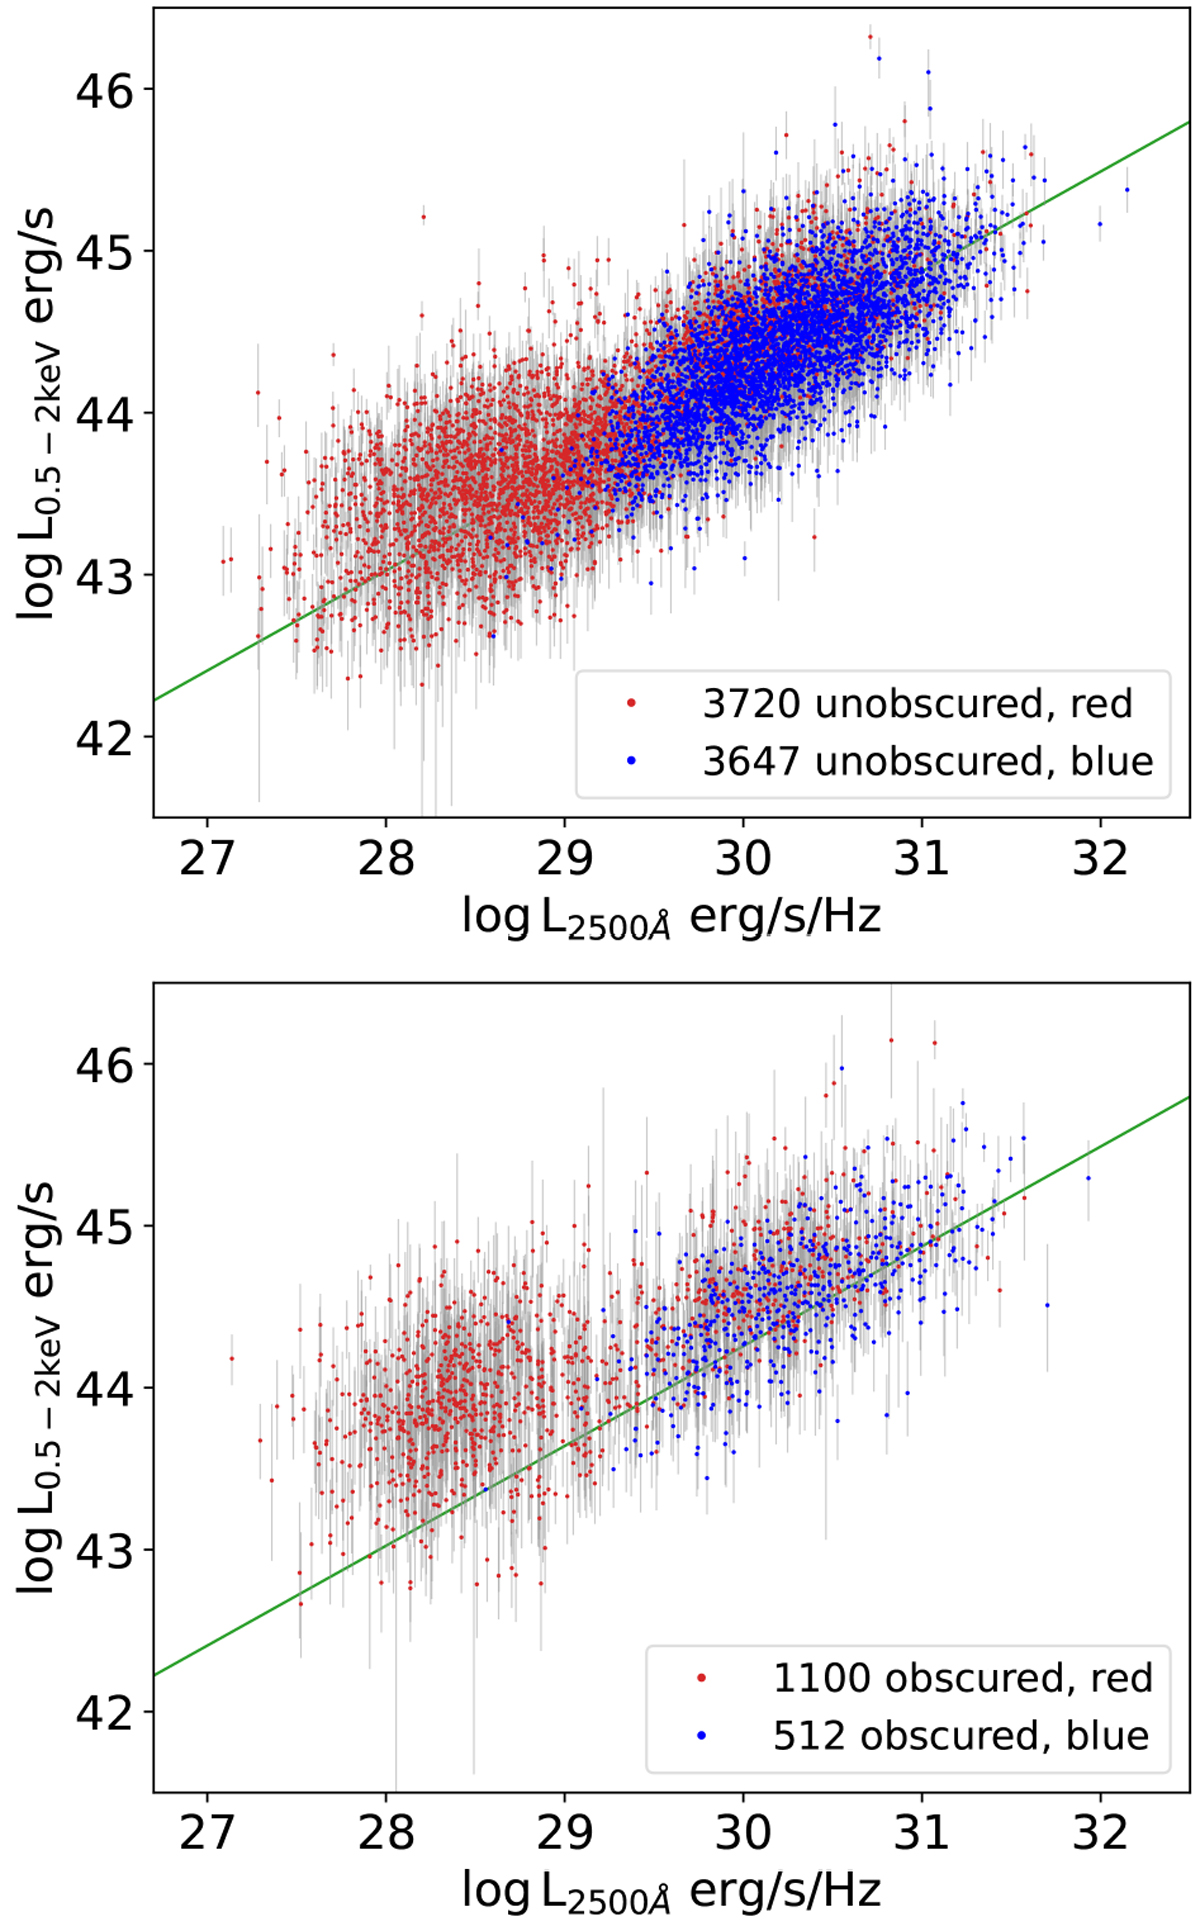
X-ray 0.5–2 keV luminosity vs UV 2500 Åluminosity scatter plots for the X-ray unobscured AGN (upper panel) and X-ray obscured AGN (lower), respectively. UV-strong AGN and UV-weak AGN (with L5100–L2500 below and above 0.2) are plotted in blue and red, respectively. The green lines are obtained by linear regression among the unobscured, UV-strong AGN (blue points in the upper panel).
Current usage metrics show cumulative count of Article Views (full-text article views including HTML views, PDF and ePub downloads, according to the available data) and Abstracts Views on Vision4Press platform.
Data correspond to usage on the plateform after 2015. The current usage metrics is available 48-96 hours after online publication and is updated daily on week days.
Initial download of the metrics may take a while.