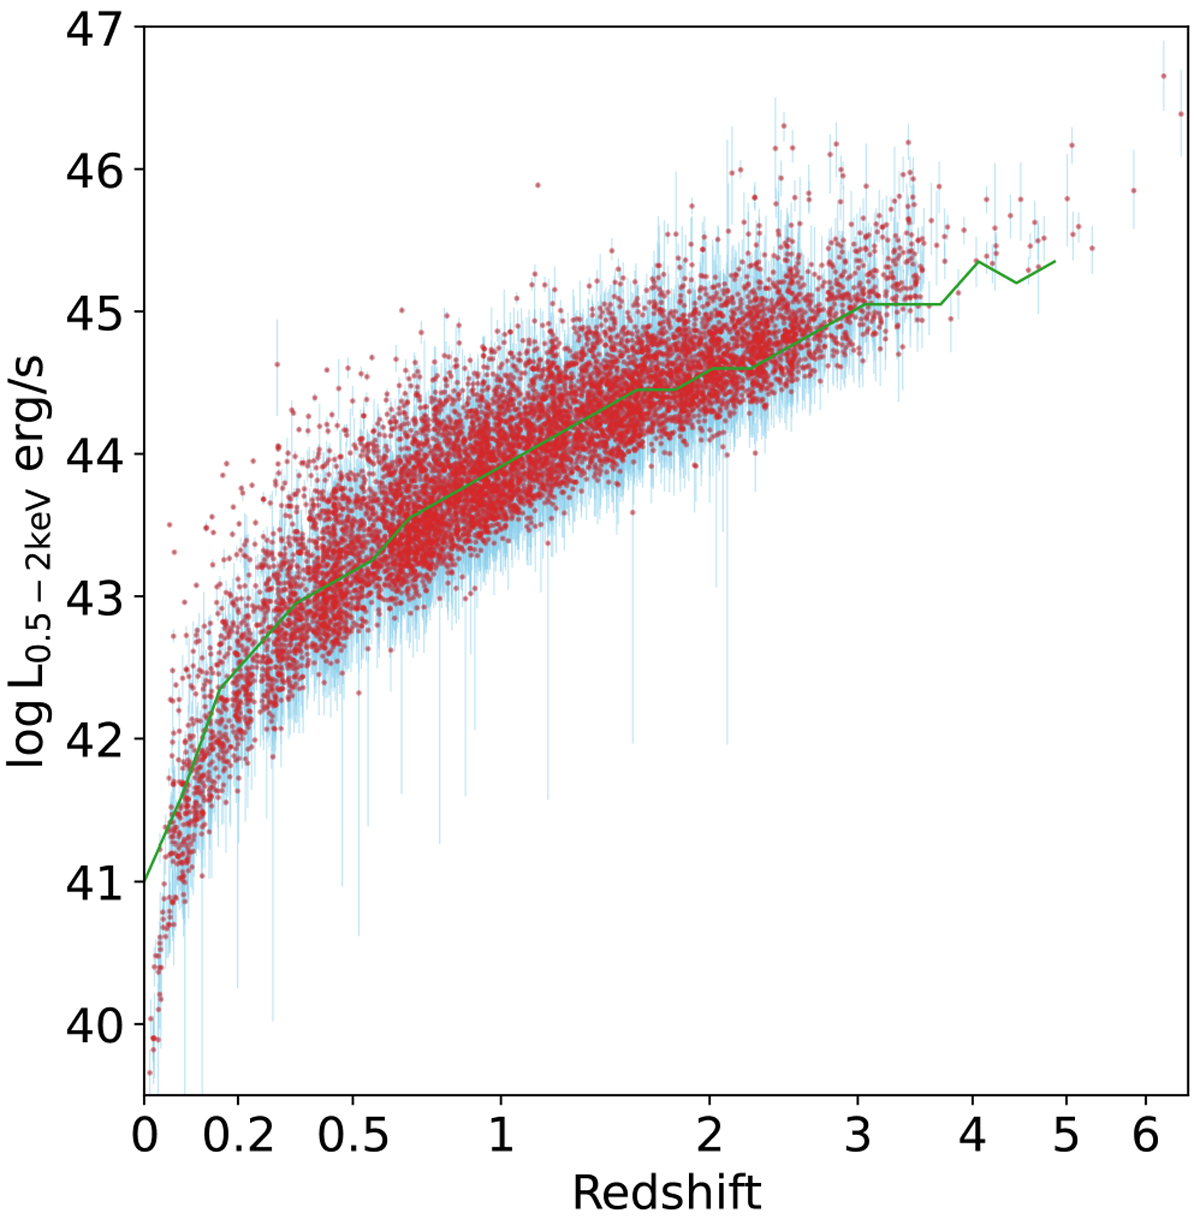
Fig. 16
Download original image
Rest-frame 0.5–2 keV intrinsic luminosity Lx and redshift (in the scale of log(l + z)) distribution of the AGN with good redshift measurements (zG ⩾ 3) and with spectral measurements of Lx (LxModel 1,3,or 4). The median and the 68% percentile interval measured from the posterior Lx distributions are plotted with red points and light-blue error bars. The green line is the 90%-detection curve of AGN with logNH < 21 measured through simulation (Liu et al. 2022b). For representation purposes, we only plot randomly-selected half of the sources.
Current usage metrics show cumulative count of Article Views (full-text article views including HTML views, PDF and ePub downloads, according to the available data) and Abstracts Views on Vision4Press platform.
Data correspond to usage on the plateform after 2015. The current usage metrics is available 48-96 hours after online publication and is updated daily on week days.
Initial download of the metrics may take a while.