Fig. 14
Download original image
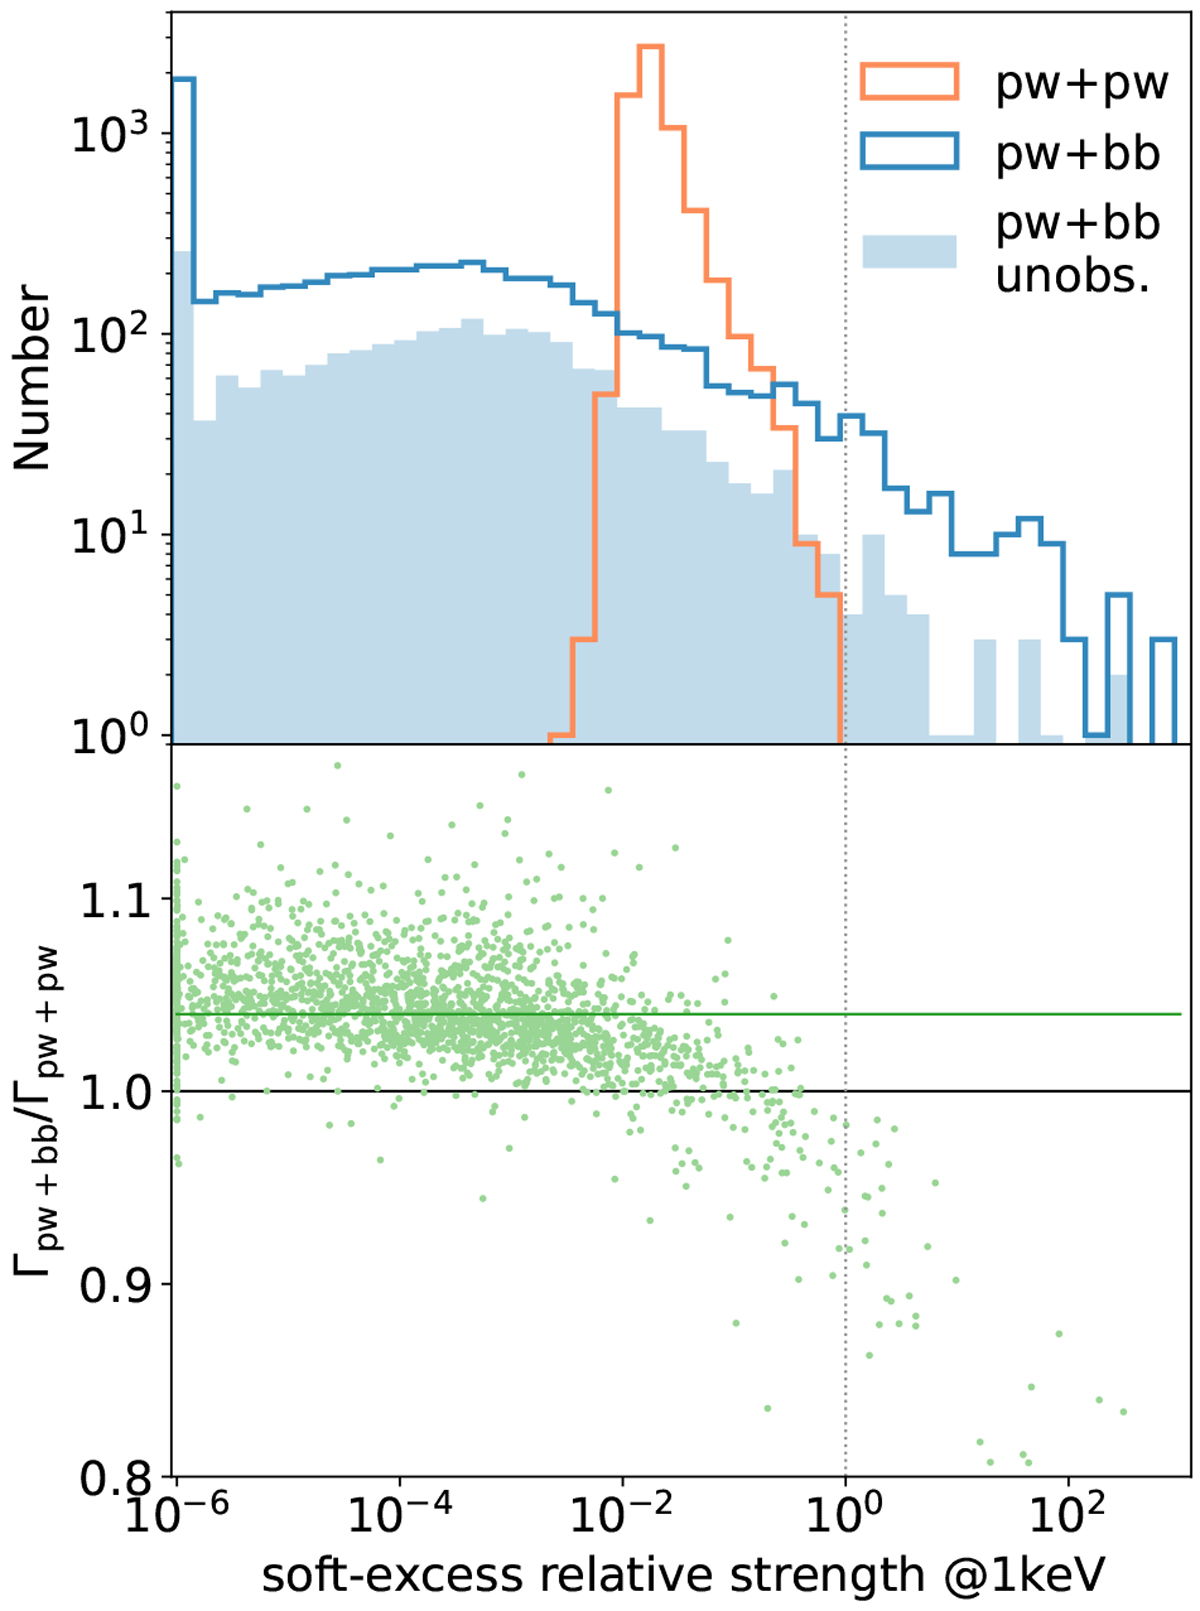
Upper panel: distributions of the soft-excess relative strength measured by the powerlaw + blackbody model (blue) and the double-powerlaw model (orange), respectively, for the AGN with good redshifts and at least 20 net counts. The values are clipped at a lower limit of 10−6. The blue filled histograms indicate an unobscured subsample with the NH measured by the powerlaw + blackbody model below 1020.5 cm−2. Lower panel: ratio between the slopes of the primary power-law measured by the two models for the unobscured subsample as a function of the blackbody relative strength. The green horizontal line indicates the median value (1.04) of the ratio.
Current usage metrics show cumulative count of Article Views (full-text article views including HTML views, PDF and ePub downloads, according to the available data) and Abstracts Views on Vision4Press platform.
Data correspond to usage on the plateform after 2015. The current usage metrics is available 48-96 hours after online publication and is updated daily on week days.
Initial download of the metrics may take a while.