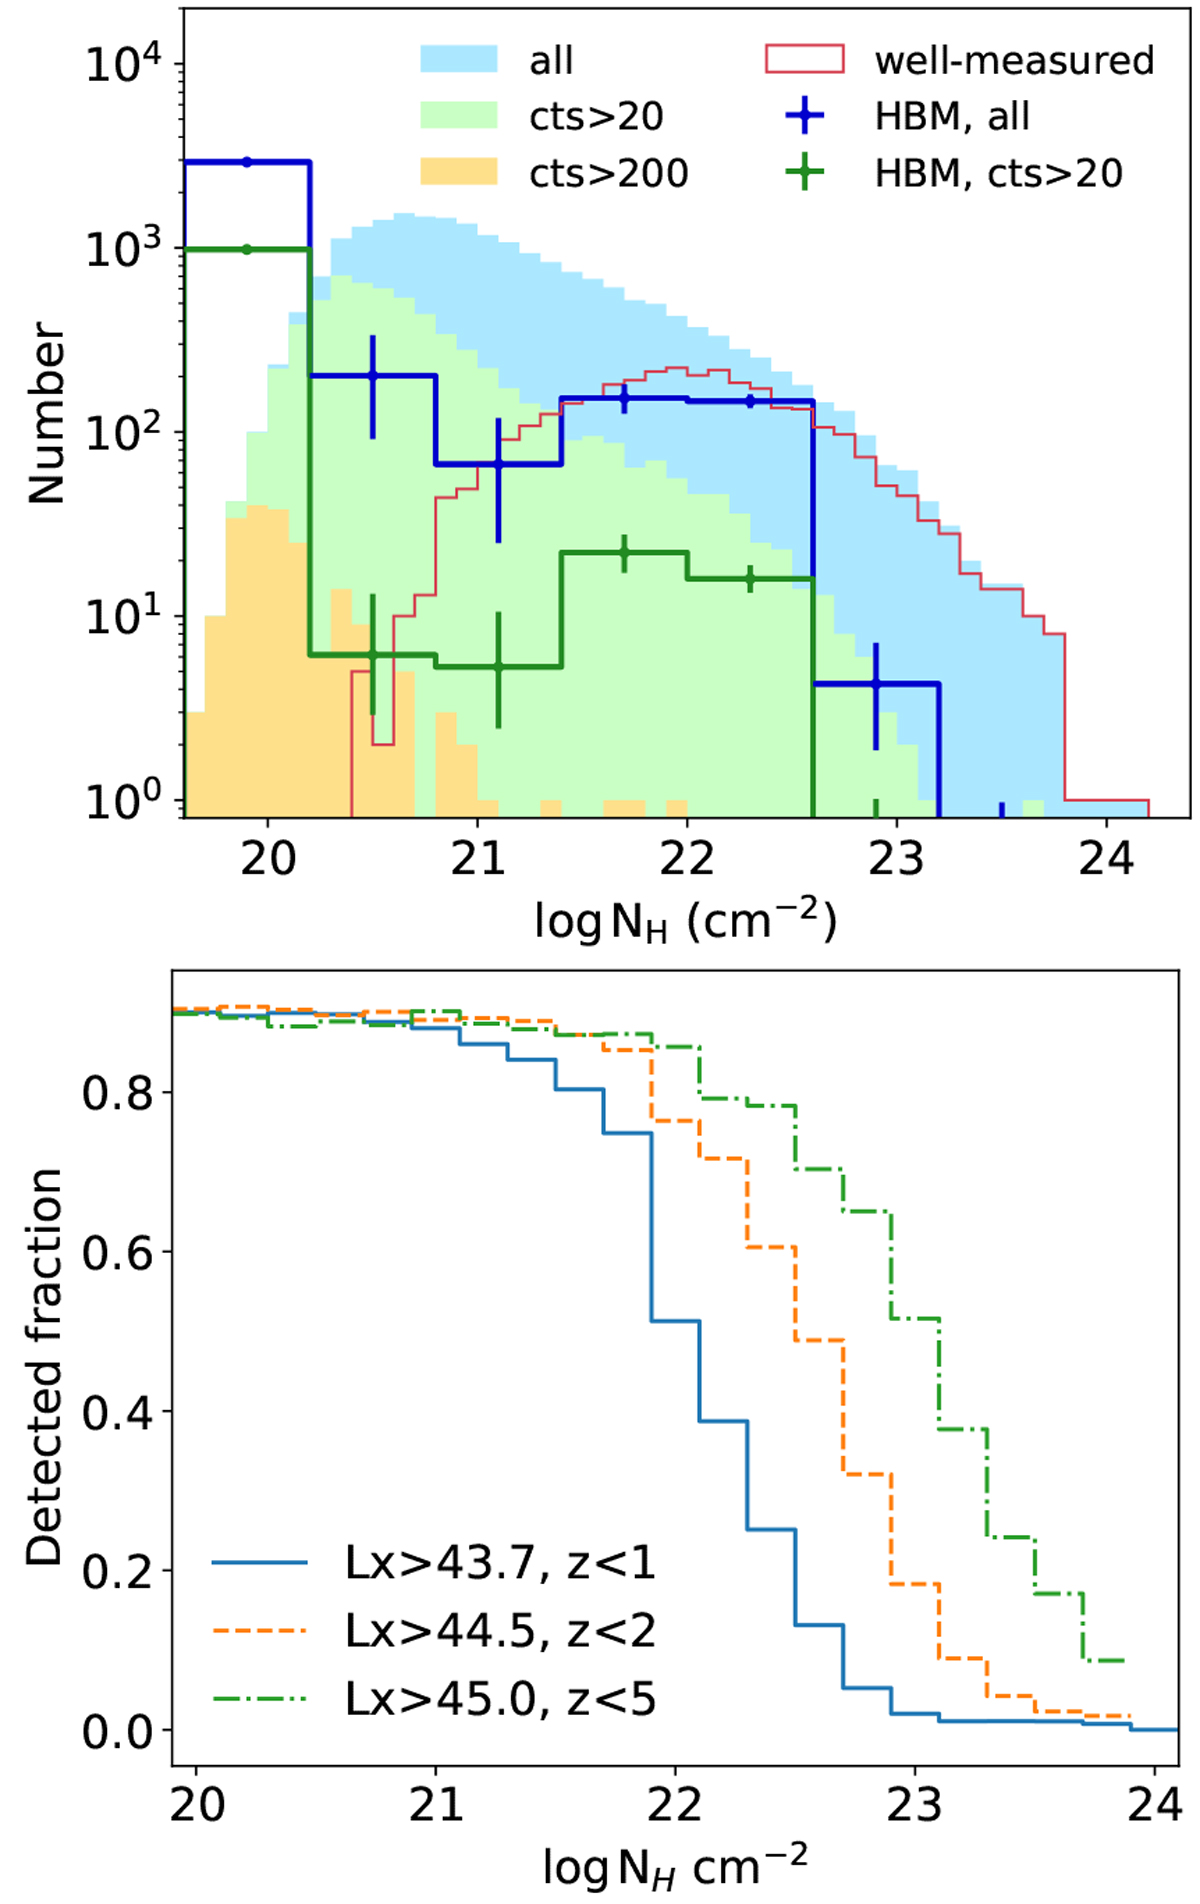
Fig. 11
Download original image
Upper panel: NH distribution of the eFEDS AGN with good redshifts (zG ⩾3). The stacked filled histograms display the median NH distributions of the AGN with 0.2–5 keV net counts >200 (196 sources; yellow), >20 (6181; yellow and green), and >0 (20987; yellow, green, and blue). The red empty histogram displays the median NH of the sources with well-measured NH (NHclass = 4). The blue and green empty histograms (with 1-σ errorbars) present the inferred intrinsic NH distribution using the HBM method for all the AGN with good redshifts (20987) and the subsample with at least 20 counts (6181), respectively. Lower panel: detected fraction measured by simulation as a function of NH for three subsamples of AGN with 2–10 keV intrinsic luminosity Lx above given logarithmic thresholds and redshift below given thresholds. The three Lx thresholds are selected such that the three subsamples have similar detected fractions at the lowest NH.
Current usage metrics show cumulative count of Article Views (full-text article views including HTML views, PDF and ePub downloads, according to the available data) and Abstracts Views on Vision4Press platform.
Data correspond to usage on the plateform after 2015. The current usage metrics is available 48-96 hours after online publication and is updated daily on week days.
Initial download of the metrics may take a while.