Fig. 1
Download original image
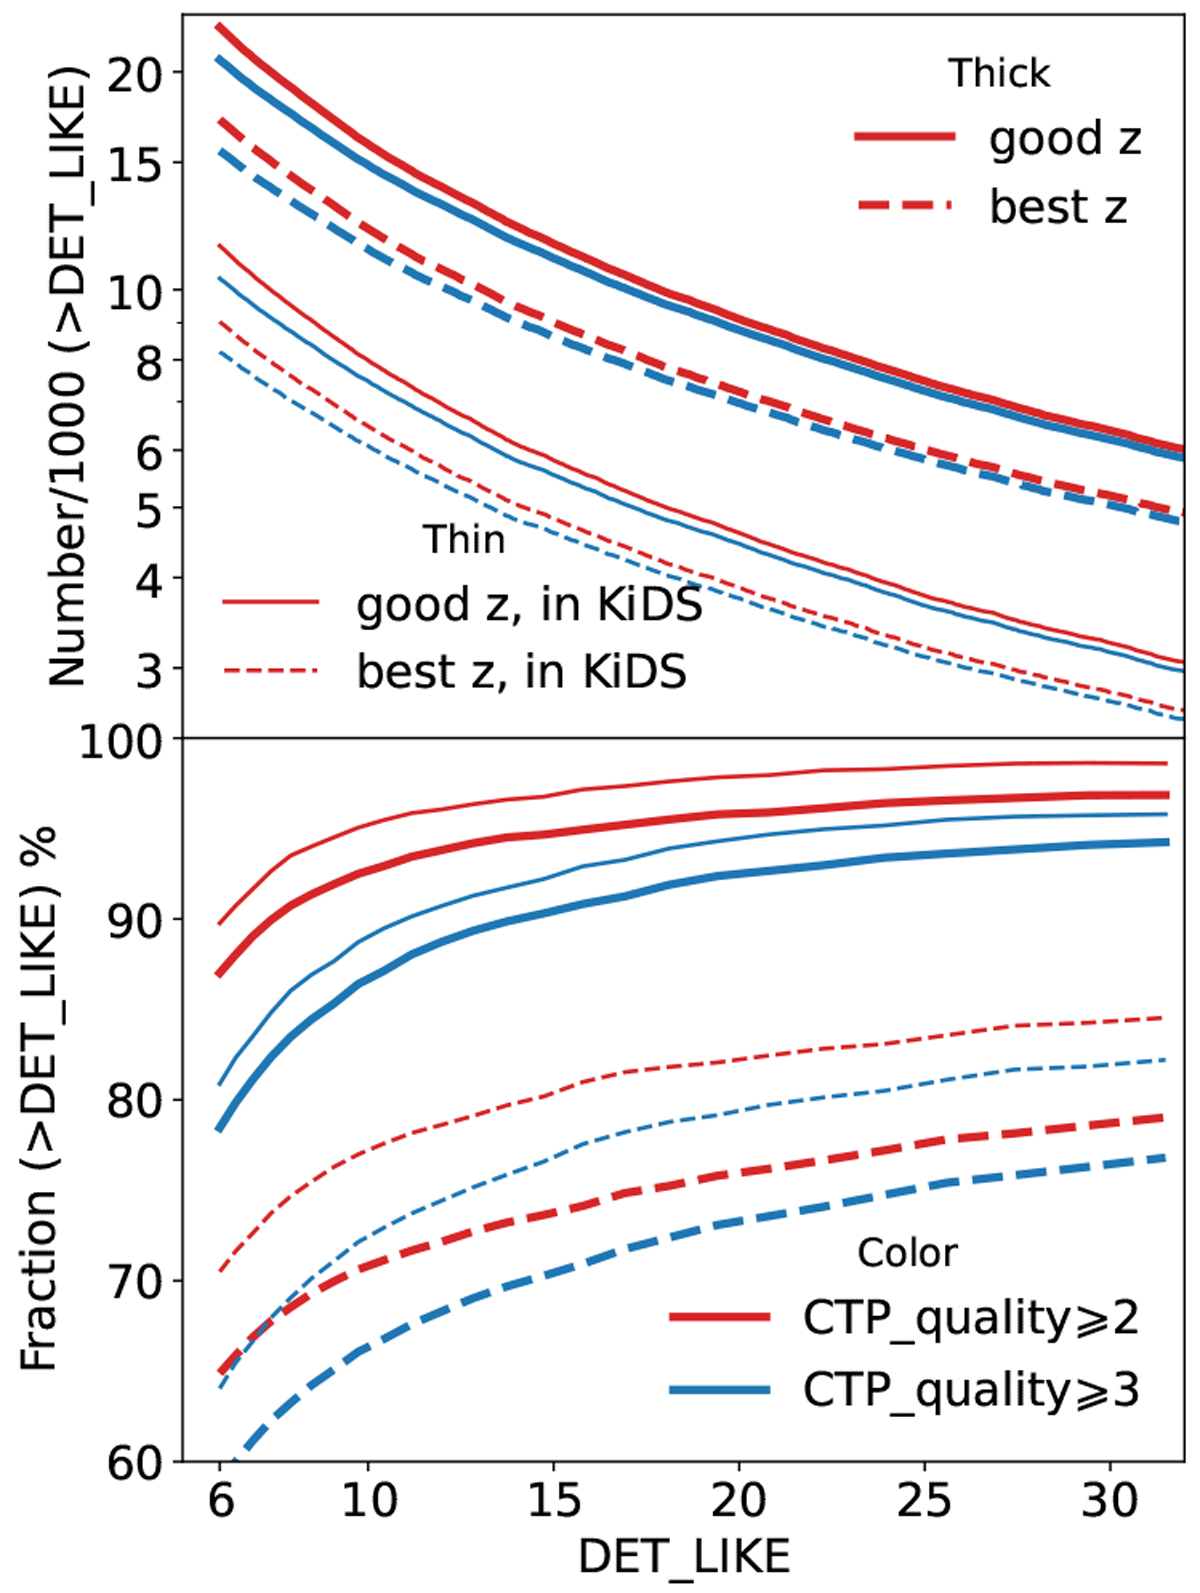
Number of X-ray sources (upper panel) and fractions of sources (lower) resulted from counterpart quality and redshift quality selections. The red and blue lines indicate counterpart quality ⩾2 and ⩾3. respectively. The solid and dashed lines indicate good (zG ⩾3) and best (zG ⩾4) redshift measurements, respectively. The thick and thin lines indicate sources in the eFEDS 90%-area region and the KiDS region, respectively.
Current usage metrics show cumulative count of Article Views (full-text article views including HTML views, PDF and ePub downloads, according to the available data) and Abstracts Views on Vision4Press platform.
Data correspond to usage on the plateform after 2015. The current usage metrics is available 48-96 hours after online publication and is updated daily on week days.
Initial download of the metrics may take a while.