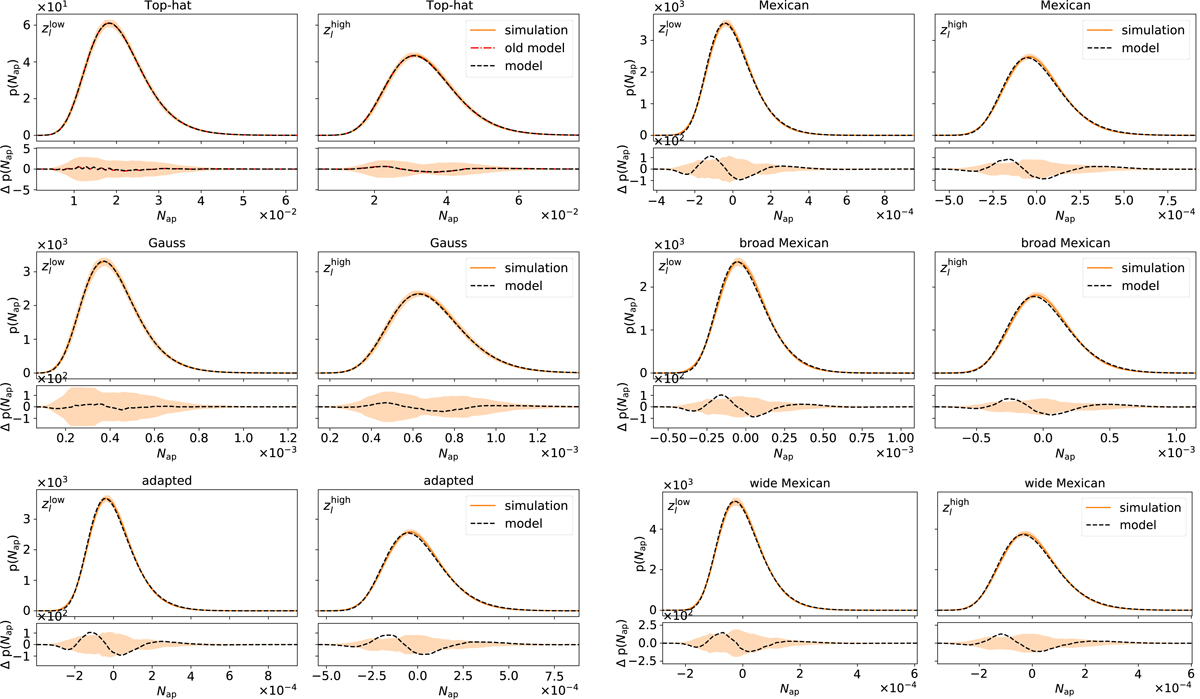
Fig. 5.
Download original image
PDF of Nap calculated with the filters U in Fig. 3. The orange lines are determined with the simulations and the orange shaded region is the standard deviation from 48 sub-patches. The black dashed lines correspond to the results from the new model, and for comparison the red dashed line in the upper left panel is from the old model. Lower panels: residuals Δp(Nap) of all lines with respect to the simulations.
Current usage metrics show cumulative count of Article Views (full-text article views including HTML views, PDF and ePub downloads, according to the available data) and Abstracts Views on Vision4Press platform.
Data correspond to usage on the plateform after 2015. The current usage metrics is available 48-96 hours after online publication and is updated daily on week days.
Initial download of the metrics may take a while.