Fig. 5.
Download original image
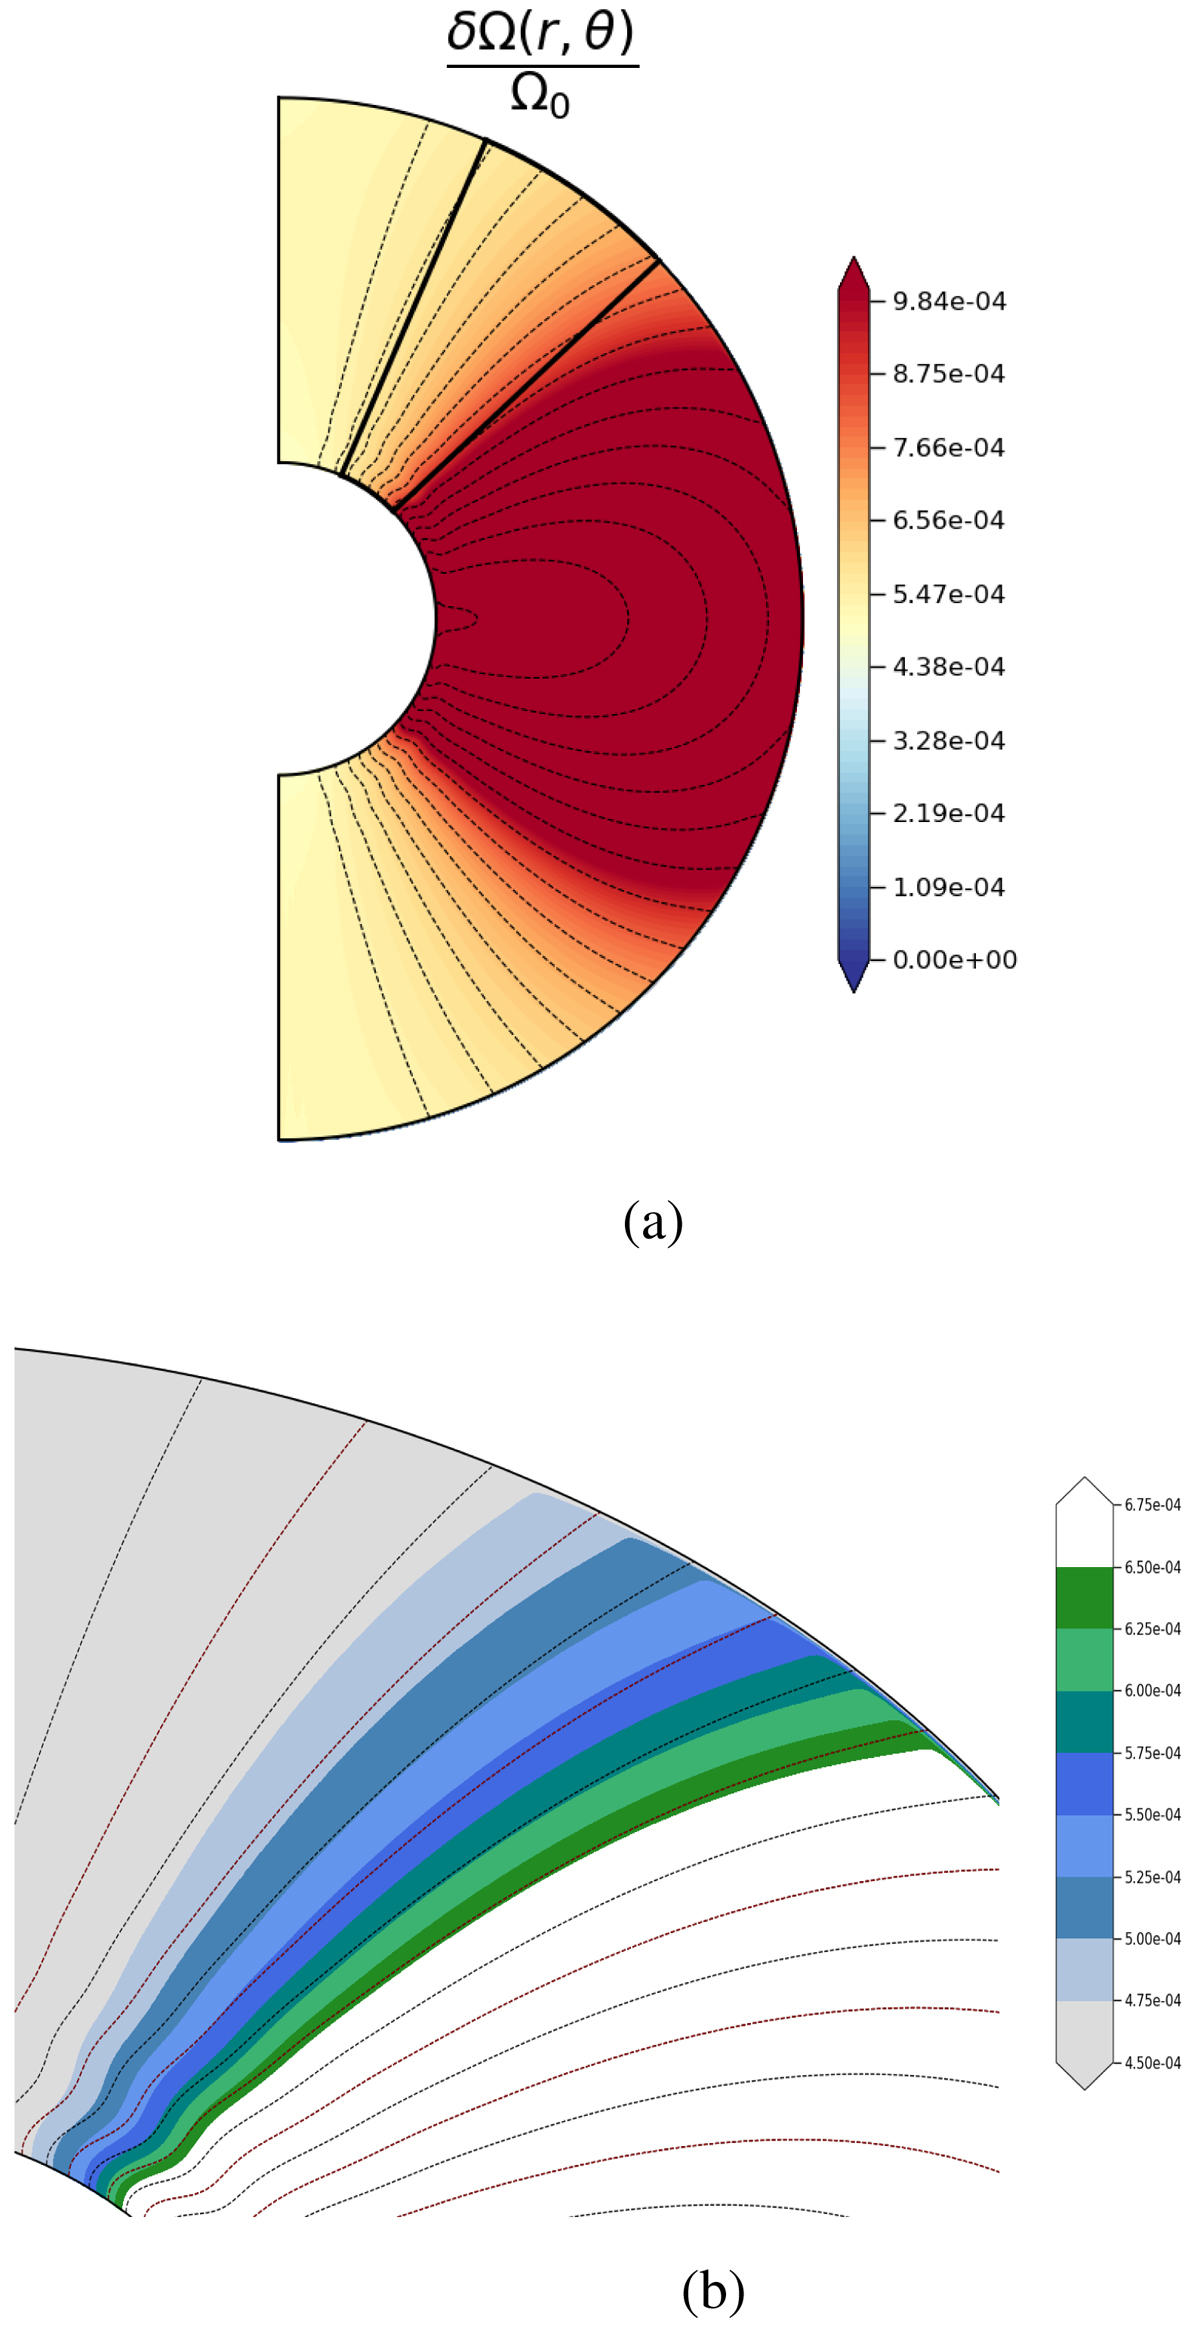
Normalised rotation rate in the quasi-steady state. Top panel (5a): this is the third panel of Fig. 3 presented on a smaller rotation rate scale. As a result, the DZ is saturated in colour. Bottom panel (5b): enlargement of the black-delimited zone displayed in the top panel. In each panels, the poloidal field lines are also represented (black lines). For the sake of clarity, every other field line is plotted in red in the bottom panel. The parameters are the same as in Figs. 3 and 4.
Current usage metrics show cumulative count of Article Views (full-text article views including HTML views, PDF and ePub downloads, according to the available data) and Abstracts Views on Vision4Press platform.
Data correspond to usage on the plateform after 2015. The current usage metrics is available 48-96 hours after online publication and is updated daily on week days.
Initial download of the metrics may take a while.