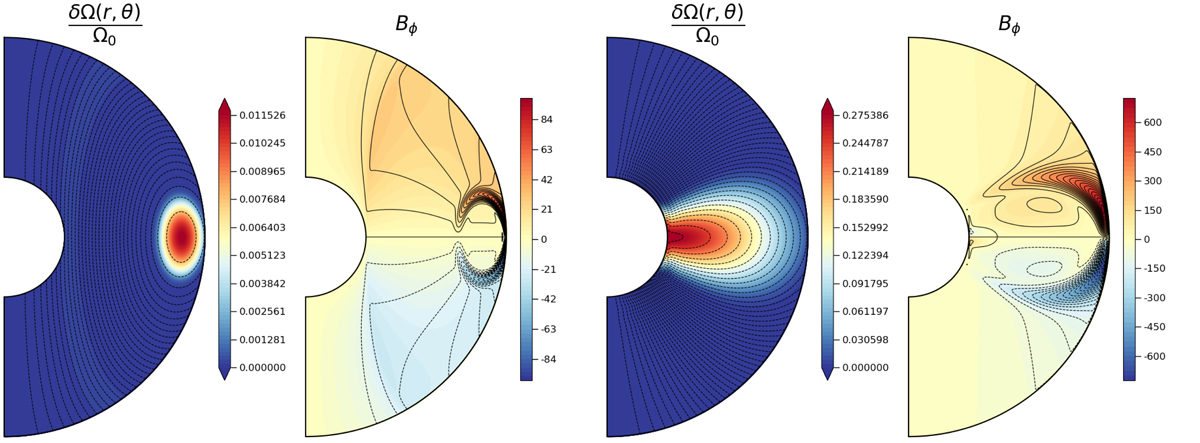
Fig. 3.
Download original image
Meridional cuts of the rotation rate normalised to the value at the outer sphere (first and third panels) and toroidal field (second and fourth panels), in the quasi-steady state. In black lines are also represented the poloidal field lines (first and third panels) and the streamlines associated with the electrical-current function defined in Appendix A (second and fourth panels). The dotted (solid) lines then correspond to an anticlockwise (clockwise) current circulation. In the first two panels, the contraction does not advect the poloidal field lines and the quasi-steady state is achieved after ∼0.04τc (i.e. ∼ 20τAp, see Fig. 2). In the last two panels such an advection is allowed and the quasi-steady configuration is reached after ∼1τc (i.e. after ∼100τAp for this simulation). For these two cases, the Lundquist numbers are respectively Lu = 5 × 10⁴ and Lu = 104 (runs D5 and D13). The other parameters are identical, namely Pr(N0/Ω0)2 = 104, E = 10−4, Rec = 1, and Pm = 102.
Current usage metrics show cumulative count of Article Views (full-text article views including HTML views, PDF and ePub downloads, according to the available data) and Abstracts Views on Vision4Press platform.
Data correspond to usage on the plateform after 2015. The current usage metrics is available 48-96 hours after online publication and is updated daily on week days.
Initial download of the metrics may take a while.