Fig. 25.
Download original image
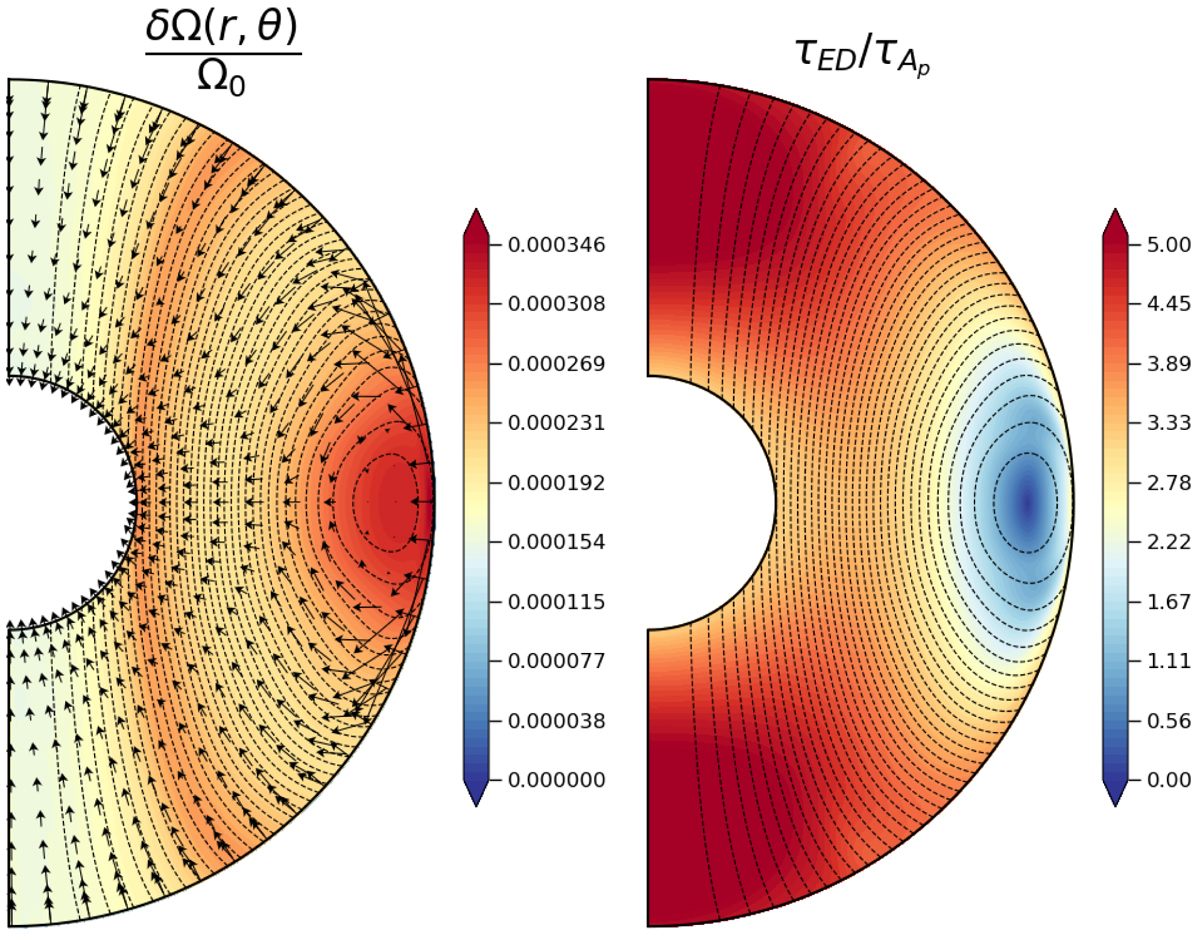
Meridional cut of the normalised differential rotation δΩ/Ω0 (left panel) and 2D map comparing the Eddington–Sweet time to the Alfvén time (right panel). This one is locally estimated such as ![]() . In these two panels, the poloidal field lines are also plotted in black. In addition, in the left panel, the vector lines of the total meridional velocity field
. In these two panels, the poloidal field lines are also plotted in black. In addition, in the left panel, the vector lines of the total meridional velocity field ![]() are plotted as black arrows. The parameters are Rec = 1, Lu = 5 × 10⁴, Pr(N0/Ω0)2 = 10−2, E = 10−5, Pm = 102 and ρi/ρ0 = 20.85 (run D36 of Table 1).
are plotted as black arrows. The parameters are Rec = 1, Lu = 5 × 10⁴, Pr(N0/Ω0)2 = 10−2, E = 10−5, Pm = 102 and ρi/ρ0 = 20.85 (run D36 of Table 1).
Current usage metrics show cumulative count of Article Views (full-text article views including HTML views, PDF and ePub downloads, according to the available data) and Abstracts Views on Vision4Press platform.
Data correspond to usage on the plateform after 2015. The current usage metrics is available 48-96 hours after online publication and is updated daily on week days.
Initial download of the metrics may take a while.