Fig. 23.
Download original image
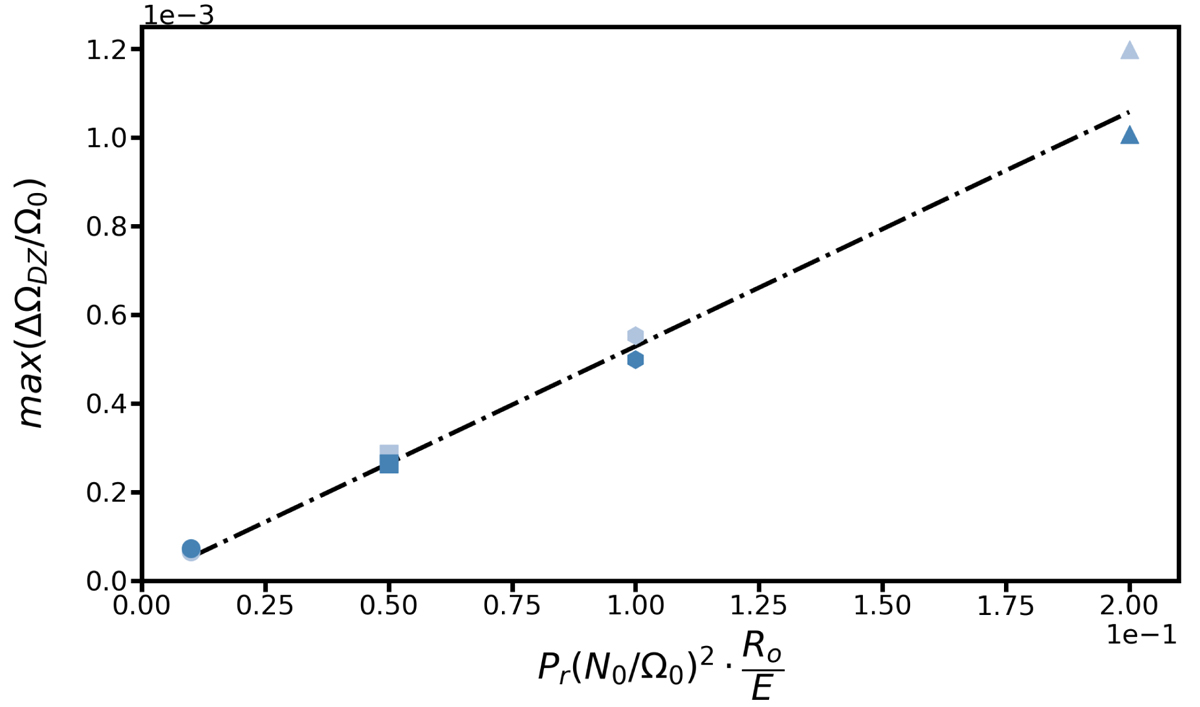
Maximum contrast of differential rotation inside the DZ as a function of Pr(N0/Ω0)2Rec. The different symbols circle, square, hexagon and triangle respectively correspond to the simulations performed at Rec = 10−1, 5 × 10⁻¹, 1, and 2. Runs carried out at Lu = 5 × 10⁴ are presented in light blue, and those at Lu = 105, in blue. The other parameters are Pr(N0/Ω0)2 = 10−1, E = 10−5, Pm = 102, and ρi/ρ0 = 20.85 (runs D21–D24 and D27–D30 of Table 1).
Current usage metrics show cumulative count of Article Views (full-text article views including HTML views, PDF and ePub downloads, according to the available data) and Abstracts Views on Vision4Press platform.
Data correspond to usage on the plateform after 2015. The current usage metrics is available 48-96 hours after online publication and is updated daily on week days.
Initial download of the metrics may take a while.