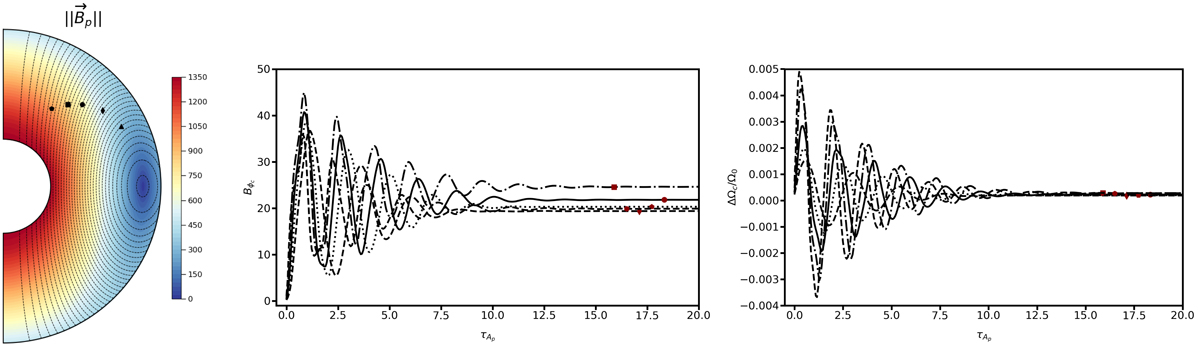
Fig. 2.
Download original image
Illustration of the unsteady phase. Left panel: meridional cut of the norm of the poloidal magnetic field. The black dots show the position of 5 control points located on different field lines. In the other two panels, the temporal evolution of these points is followed during 20τAp, both for the toroidal field Bϕc (middle panel) and the normalised differential rotation ΔΩc/Ω0 (right panel). The parameters are E = 10−4, Pr(N0/Ω0)2 = 104, Rec = 1, Lu = 5 × 10⁴, and Pm = 102 (run D5 of Table 1).
Current usage metrics show cumulative count of Article Views (full-text article views including HTML views, PDF and ePub downloads, according to the available data) and Abstracts Views on Vision4Press platform.
Data correspond to usage on the plateform after 2015. The current usage metrics is available 48-96 hours after online publication and is updated daily on week days.
Initial download of the metrics may take a while.