Fig. 18.
Download original image
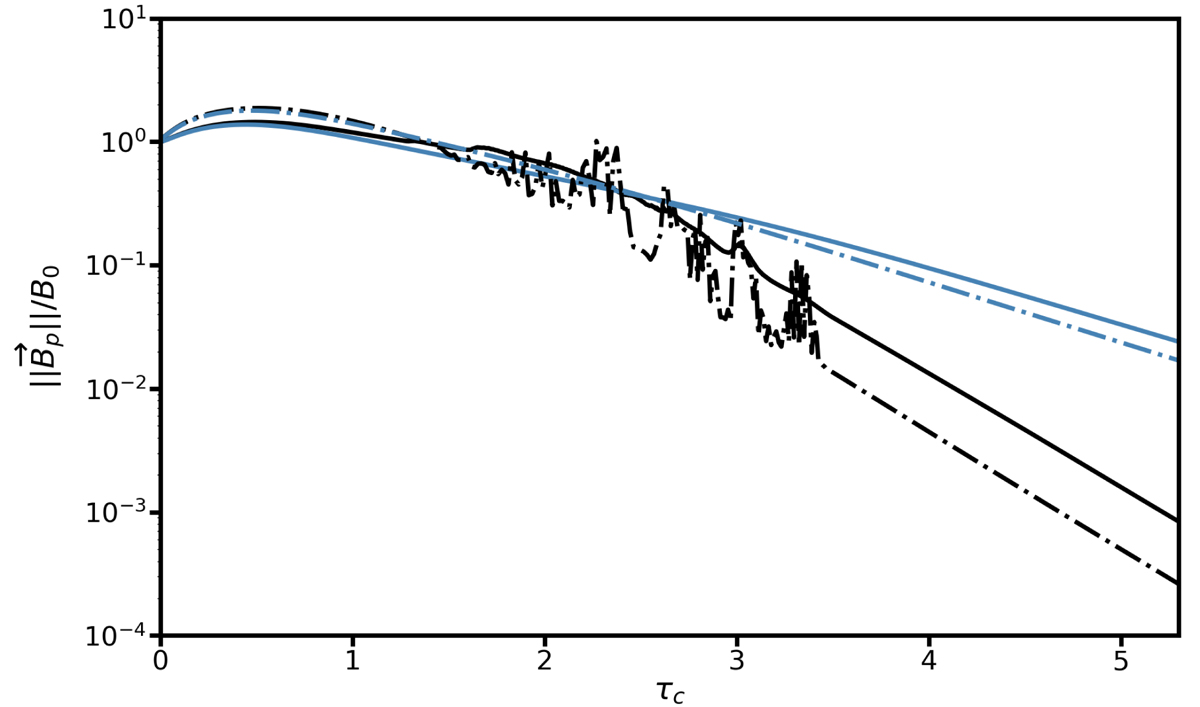
Temporal evolution of the norm of the poloidal magnetic field normalised to B0, as a function of the contraction timescale τc. Plain curves represent a volume-averaged evolution and dashed-dotted ones, a local evolution at the fixed point displayed in black in Fig. 17 (r = 0.47r0 and θ ≈ 2π/5). The stable and unstable configurations, Rec = 0.5 and 1, are respectively distinguished by their blue and black colours. The other parameters are E = 10−4, Pr(N0/Ω0)2 = 104, Pm = 102, and Lu = 104 (runs Q8 and Q10 of Table 1).
Current usage metrics show cumulative count of Article Views (full-text article views including HTML views, PDF and ePub downloads, according to the available data) and Abstracts Views on Vision4Press platform.
Data correspond to usage on the plateform after 2015. The current usage metrics is available 48-96 hours after online publication and is updated daily on week days.
Initial download of the metrics may take a while.