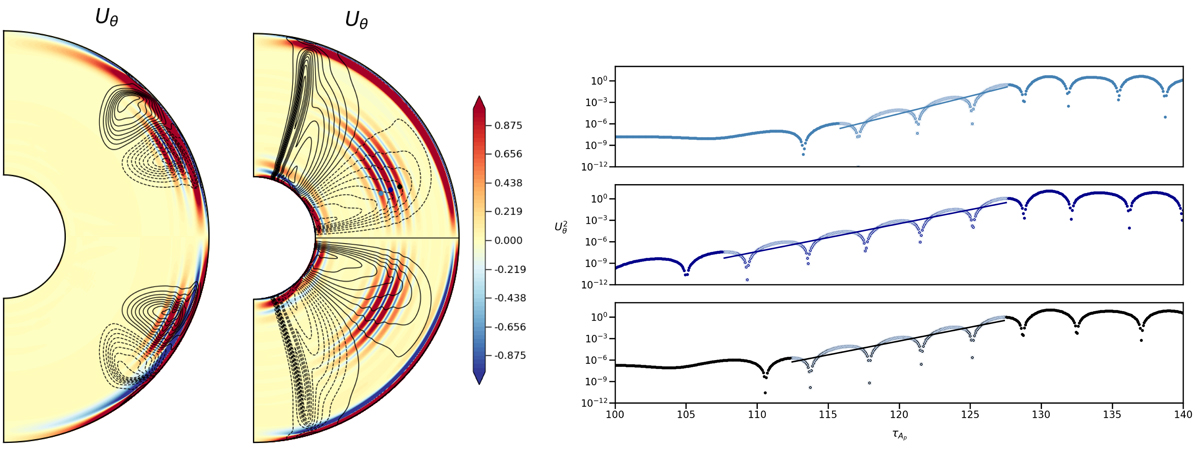
Fig. 15.
Download original image
Axisymmetric instability in the viscous regime when the quadrupolar field given by Eq. (23) and illustrated in Fig. 1, is initially imposed. First two panels: snapshots of the latitudinal component of the velocity field Uθ taken during the developing of the instability, at t = 14.1τAp when the contraction does not act on the field lines (first panel) and at t = 127.4τAp when it does (second panel). In these cuts are also represented the contours of the latitudinal shear ∂lnΩ/∂θ in black, with dashed lines corresponding to a negative shear and full lines to a positive one. In the second panel, three control points (in light blue, blue and black) are chosen at the location where the instability grows. Third panel: temporal evolution of the square of the latitudinal component of the velocity field at these selected points (with the same colour code), as a function of the Alfvén poloidal time. In each subplot, a coloured straight line is also presented as the result of a linear regression used to deduce a growth rate associated with the instability. The parameters are those of the runs Q4 and Q10 of Table 1 namely, Rec = 5 (first panel) and Rec = 1 (two last panels), with E = 10−4, Pr(N0/Ω0)2 = 104, Pm = 102, and Lu = 104.
Current usage metrics show cumulative count of Article Views (full-text article views including HTML views, PDF and ePub downloads, according to the available data) and Abstracts Views on Vision4Press platform.
Data correspond to usage on the plateform after 2015. The current usage metrics is available 48-96 hours after online publication and is updated daily on week days.
Initial download of the metrics may take a while.