Fig. 14.
Download original image
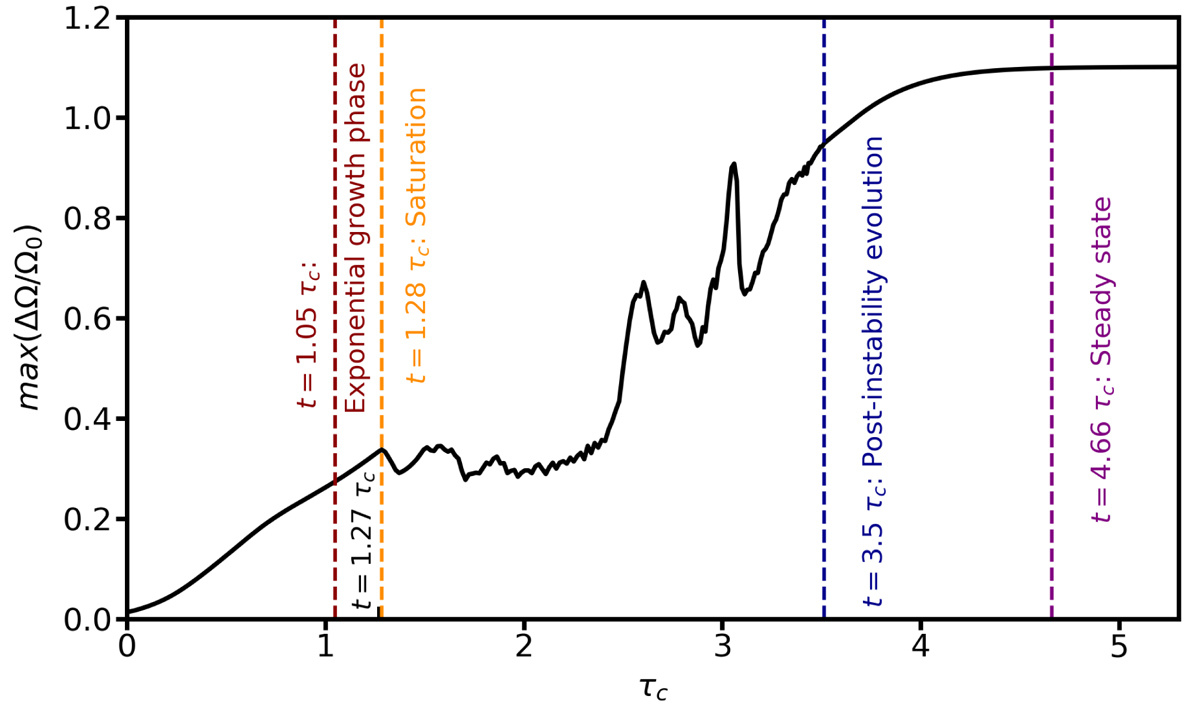
Maximum value of the normalised differential rotation max(ΔΩ/Ω0) as a function of the contraction timescale as defined in Eq. (12). The main evolution steps are highlighted by coloured dashed lines: the red dashed lines corresponds to the start of the exponential growth phase and orange, to the time at which the instability saturates, thus marking the beginning of the non-linear evolution. Then, blue marks the start of the post-instability evolution and finally, purple denotes the time at which the hydrodynamic steady state is reached. The parameters are Rec = 1, Lu = 104, E = 10−4, Pr(N0/Ω0)2 = 104, and Pm = 102 (run Q10 of Table 1, contraction term in induction equation).
Current usage metrics show cumulative count of Article Views (full-text article views including HTML views, PDF and ePub downloads, according to the available data) and Abstracts Views on Vision4Press platform.
Data correspond to usage on the plateform after 2015. The current usage metrics is available 48-96 hours after online publication and is updated daily on week days.
Initial download of the metrics may take a while.