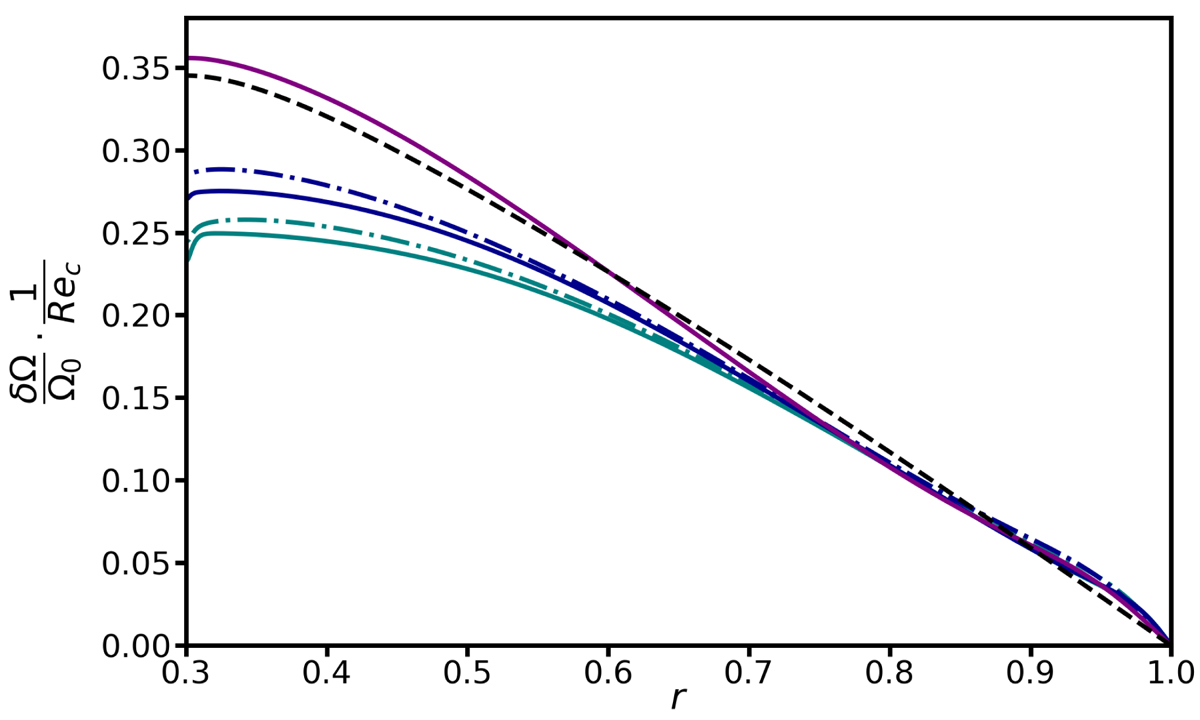
Fig. 11.
Download original image
Same as Fig. 10 but for cases where contraction acts on the field lines. The simulations presented here are the runs D10–D14 of Table 1 performed at Rec = 5 × 10⁻¹ (green), Rec = 1 (blue), and Rec = 2 (purple). For all these cases Lu = 104, but for Rec = 5 × 10⁻¹ and 1, additional simulations are shown at Lu = 5 × 10³ in dash-dot lines. The analytical solution Eq. (40) is displayed in black dashed lines.
Current usage metrics show cumulative count of Article Views (full-text article views including HTML views, PDF and ePub downloads, according to the available data) and Abstracts Views on Vision4Press platform.
Data correspond to usage on the plateform after 2015. The current usage metrics is available 48-96 hours after online publication and is updated daily on week days.
Initial download of the metrics may take a while.