Fig. 9

Download original image
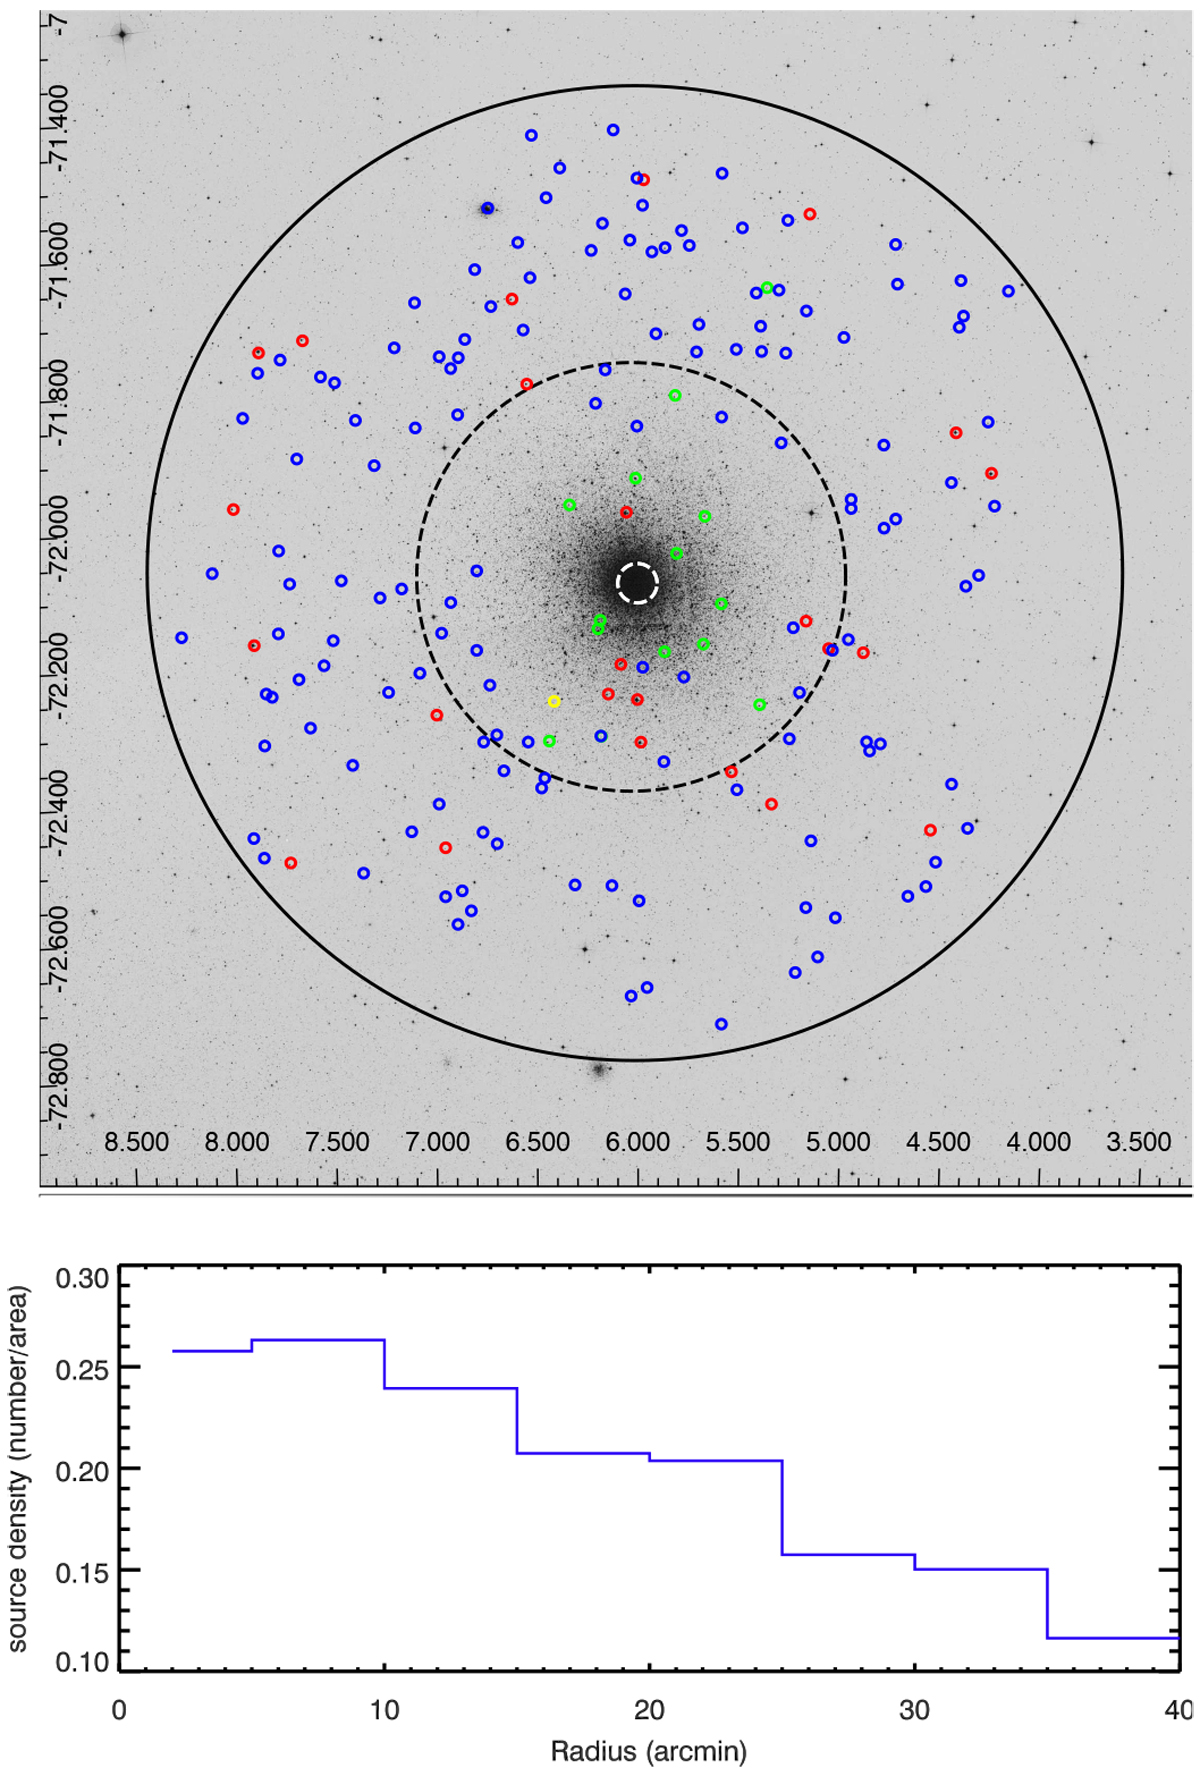
Distribution of sources in the field of 47 Tuc. Upper panel: Optical image of the field of 47 Tuc observed by the DSS survey (red filter) (Bacher et al. 2005). The solid black region shows the total area observed by eROSITA(radius of 42:0). The dashed black region is the area that was the field of view of all observations and that we used to calculate the XLF (radius of 18:08). The dashed white region is the area in which the observation of eROSITA was unresolved; we excluded it here (radius of 1:07). The positions of classified AGNs, foreground stars, and accreting binaries are shown by blue, red, and green circles, respectively. The single source classified as an XRB in the SMC is plotted in yellow. Lower panel: normalised source density vs. the radius of the field of view of the eROSITA observation. No sources are detected within a radius < 20 due to the large unresolved source in the centre.
Current usage metrics show cumulative count of Article Views (full-text article views including HTML views, PDF and ePub downloads, according to the available data) and Abstracts Views on Vision4Press platform.
Data correspond to usage on the plateform after 2015. The current usage metrics is available 48-96 hours after online publication and is updated daily on week days.
Initial download of the metrics may take a while.


