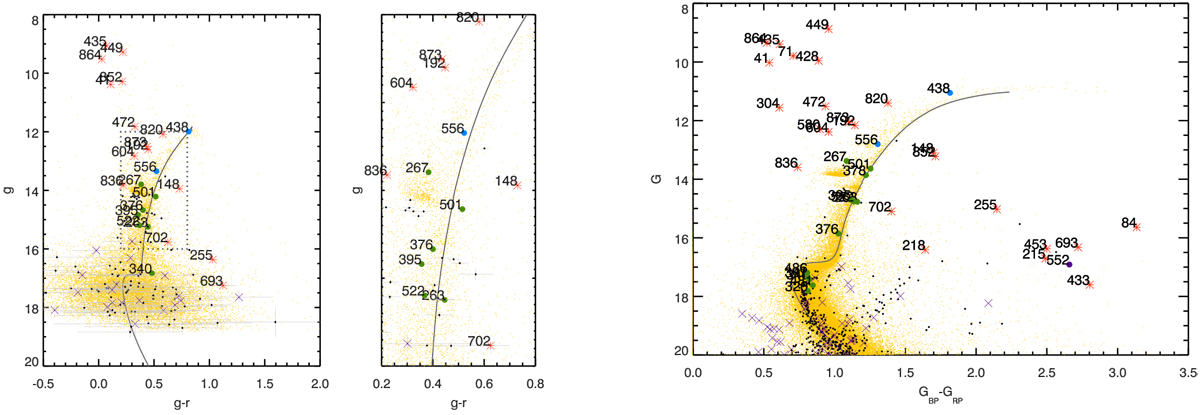
Fig. 7
Download original image
Optical counterpart of the X-ray sources in the field of 47 Tuc observed by SkyMapper (Wolf et al. 2018) (left panel) and in the Gaia third data release (Gaia Collaboration 2020) (right panel). The yellow dots are all optical sources detected in the field of 47 Tuc dSph, and the hard grey lines are the theoretical isochrone of the Dartmouth stellar evolution database (Dotter et al. 2008) for the age, metallicity, and distance of 47 Tuc (see Sect. 1). The remaining symbols are the same as in Fig. 2. To show the crowded region of the Skymapper colour-magnitude diagram better, we show a zoom into the dashed square.
Current usage metrics show cumulative count of Article Views (full-text article views including HTML views, PDF and ePub downloads, according to the available data) and Abstracts Views on Vision4Press platform.
Data correspond to usage on the plateform after 2015. The current usage metrics is available 48-96 hours after online publication and is updated daily on week days.
Initial download of the metrics may take a while.