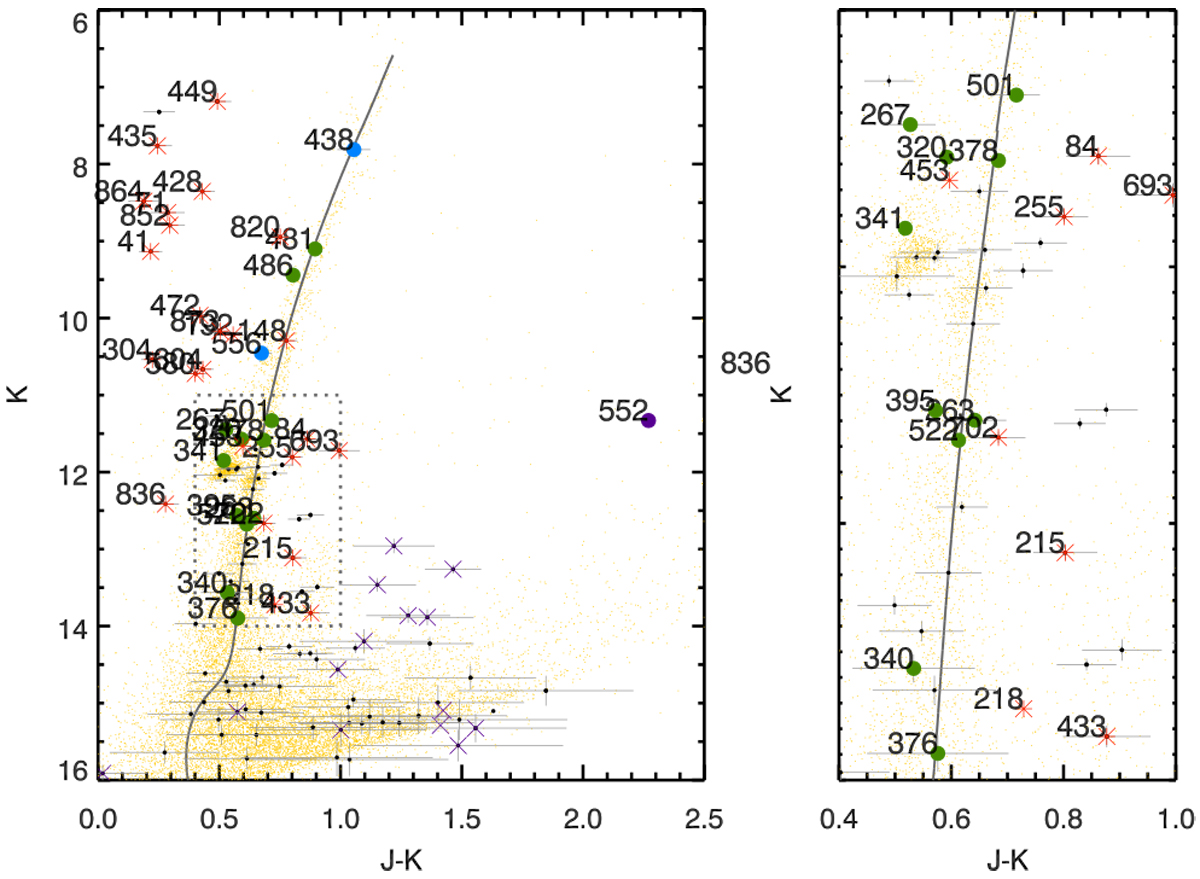
Fig. 6
Download original image
Colour-magnitude diagram of 2MASS counterparts of the X-ray sources in the field of 47 Tuc. To show the crowded region better, the left plot is a zoom into the dashed square in the right plot. The yellow dots are all 2MASS sources that are detected in the field of 47 Tuc. The symbols are the same as in Fig. 2.
Current usage metrics show cumulative count of Article Views (full-text article views including HTML views, PDF and ePub downloads, according to the available data) and Abstracts Views on Vision4Press platform.
Data correspond to usage on the plateform after 2015. The current usage metrics is available 48-96 hours after online publication and is updated daily on week days.
Initial download of the metrics may take a while.