Fig. 2

Download original image
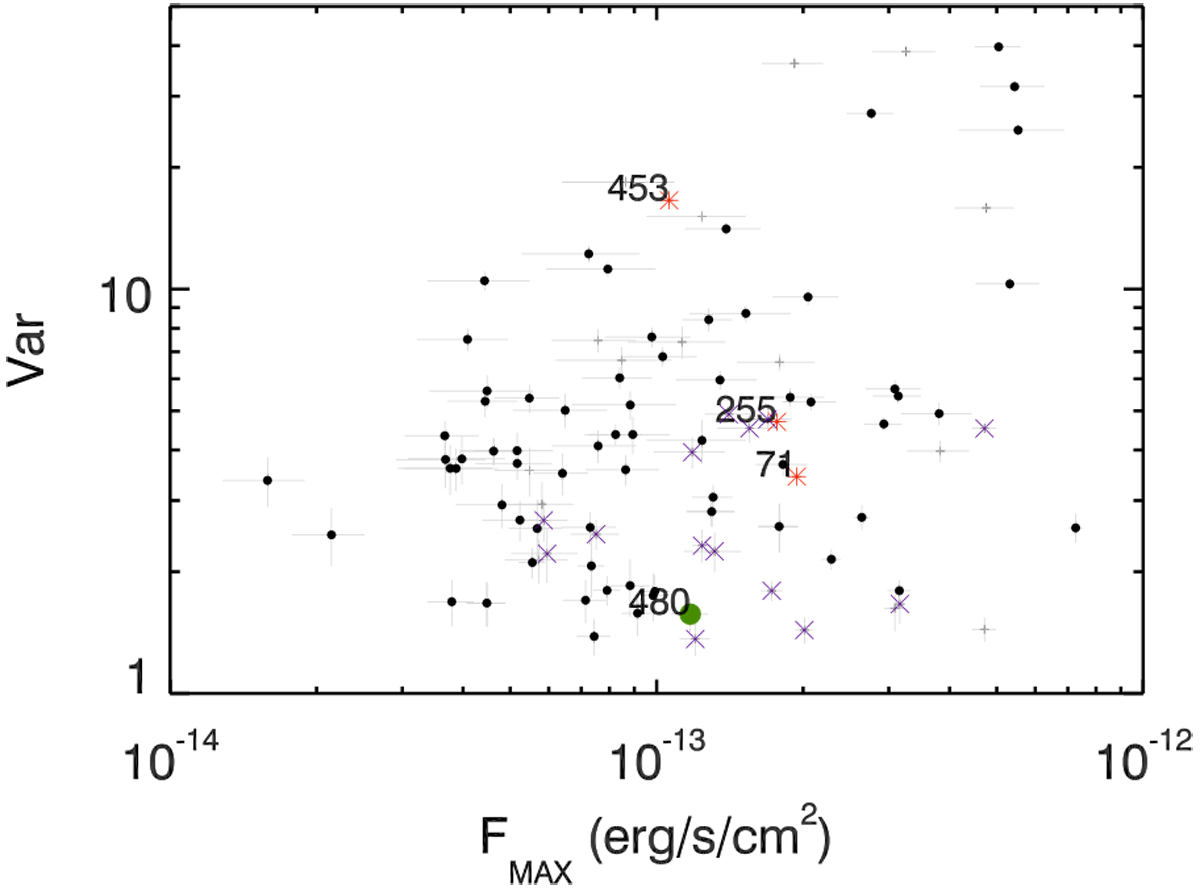
Variability factor of sources with significant variability (S > 3) in the energy band of 0.2–5.0 keV plotted vs. the maximum flux. In all the plots of these paper, the symbols characterise foreground starswith red asterisks (![]() ), background objects with violet crosses (
), background objects with violet crosses (![]() ), sources with counterpart classified as RGBs in 47 Tuc with blue filled circles (
), sources with counterpart classified as RGBs in 47 Tuc with blue filled circles (![]() ), main sequence member of 47 Tuc with green filled circles (
), main sequence member of 47 Tuc with green filled circles (![]() ), members of SMC with violet filled circles (
), members of SMC with violet filled circles (![]() ), and unclassified sources with black filled circles (
), and unclassified sources with black filled circles (![]() ).
).
Current usage metrics show cumulative count of Article Views (full-text article views including HTML views, PDF and ePub downloads, according to the available data) and Abstracts Views on Vision4Press platform.
Data correspond to usage on the plateform after 2015. The current usage metrics is available 48-96 hours after online publication and is updated daily on week days.
Initial download of the metrics may take a while.


