Fig. 8
Download original image
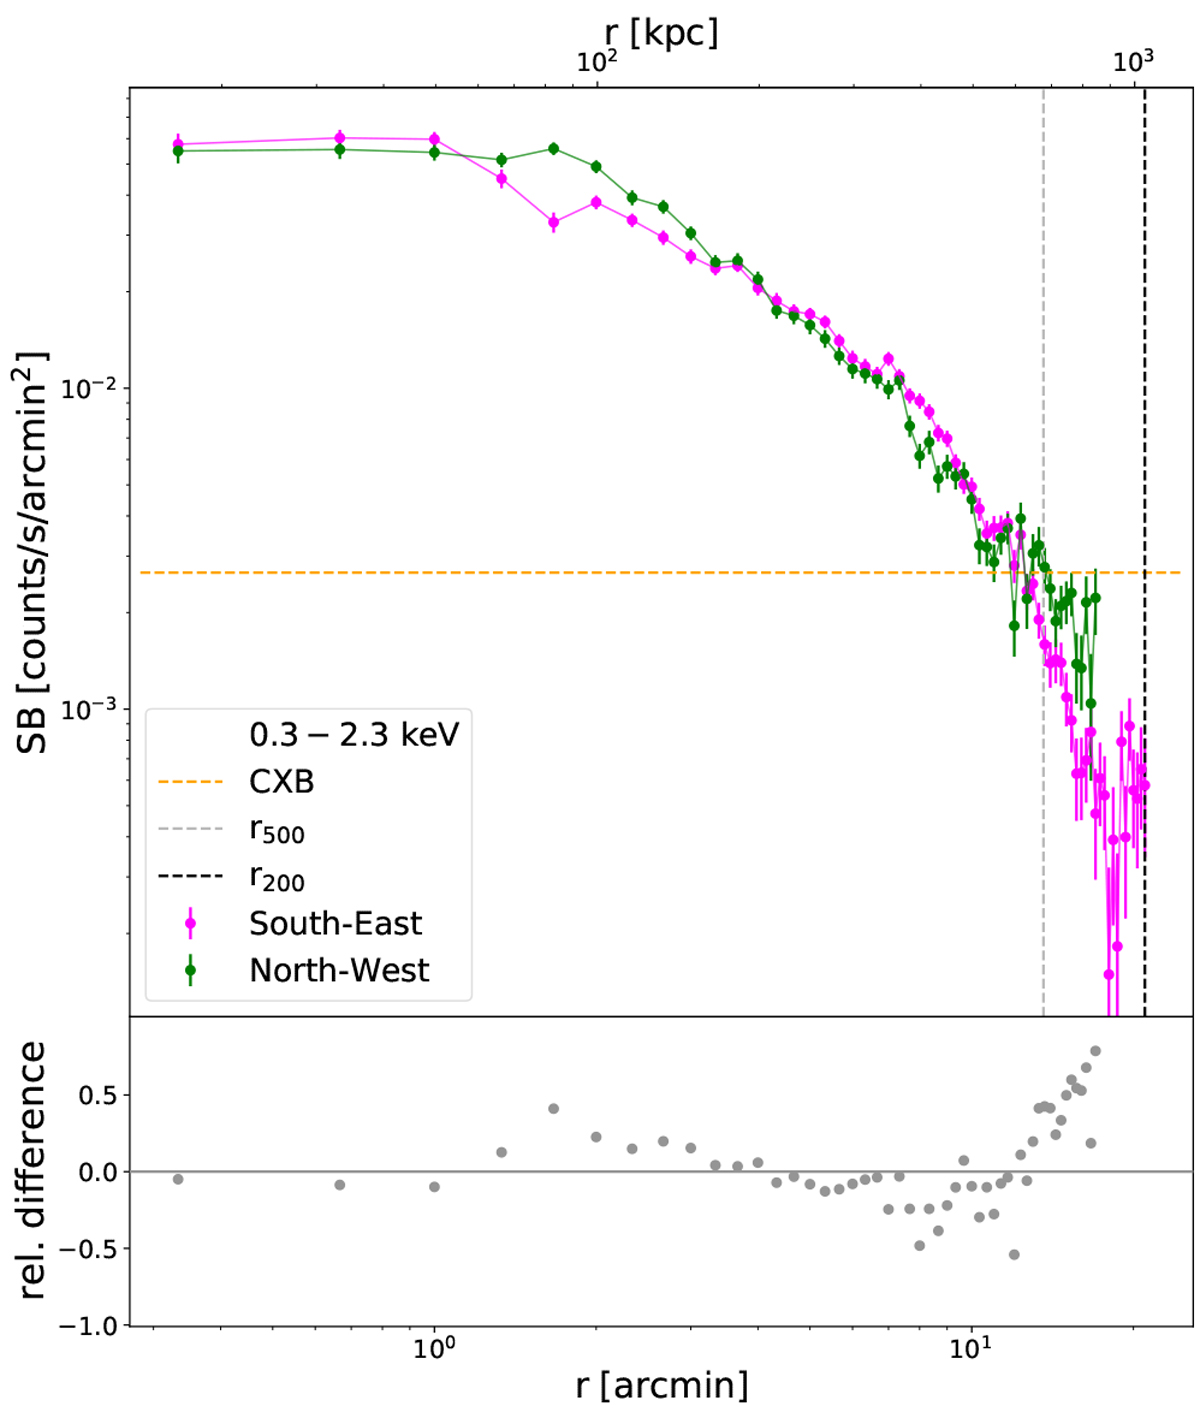
Comparison of surface brightness profiles obtained in two sectors (SE and NW, as illustrated in the left panel of Fig. 3). The CXB level is shown as a dashed orange line, and r500 and r200 are shown as dashed gray and black lines, respectively.
Current usage metrics show cumulative count of Article Views (full-text article views including HTML views, PDF and ePub downloads, according to the available data) and Abstracts Views on Vision4Press platform.
Data correspond to usage on the plateform after 2015. The current usage metrics is available 48-96 hours after online publication and is updated daily on week days.
Initial download of the metrics may take a while.